


Find the median value from the given table by drawing the curve of the values.
Weight (In kgs.) No. of students Less than $38$ $0$ Less than $40$ $3$ Less than $42$ $5$ Less than $44$ $9$ Less than $46$ $14$ Less than $48$ $28$ Less than $50$ $32$ Less than $52$ $35$
| Weight (In kgs.) | No. of students |
| Less than $38$ | $0$ |
| Less than $40$ | $3$ |
| Less than $42$ | $5$ |
| Less than $44$ | $9$ |
| Less than $46$ | $14$ |
| Less than $48$ | $28$ |
| Less than $50$ | $32$ |
| Less than $52$ | $35$ |
Answer
605.7k+ views
Hint: We will plot a cumulative frequency curve for the given distribution also called an ogive and then find the median using the graph.
Complete step-by-step solution:
From the question we know the cumulative frequency of the distribution. Since the last cumulative frequency is $35$ the given sample has the weight of total $35$ students.
Now, we have to plot the graph with taking the upper limit of weight on X-axis and the respective cumulative frequency on the Y-axis to get the less than ogive.
The points to be plotted to make a less than ogive are on the graph are: $(38,0),(40,3),(42,5),(44,9),(46,14),(48,28),(50,32),(52,35)$
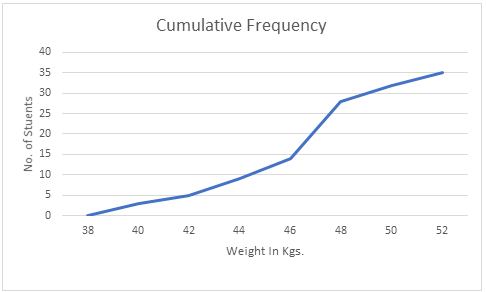
The Curve in the above graph is the Cumulative Frequency Curve i.e. the ogive.
Now to find the median:
Let $N$ be the total number of students whose data is given.
Also, $N$ will be the cumulative frequency of the last interval.
We find the ${\left[ {\dfrac{N}{2}} \right]^{th}}$ item and mark it on the y-axis.
In this case the ${\left[ {\dfrac{N}{2}} \right]^{th}}$ item is $(35/2)$ = $17.5$ student.
We draw a perpendicular from $17.5$ to the right to cut the Ogive curve.
From where the Ogive curve is cut, draw a perpendicular on the x-axis. The point at which it touches the x-axis will be the median value of the series as shown in the graph:
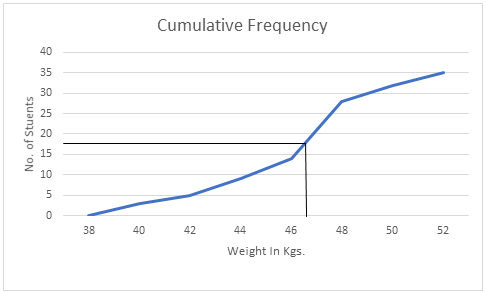
$\therefore $ From the above Graph we can see that the median is almost $47$ which is the required answer.
Note: The cumulative frequency should always be plotted on the Y-axis to get a correct ogive.
This was an example of a less than ogive, there also exists a more than ogive, in this type of ogive while making the cumulative frequency table, all the succeeding terms in the distribution should be added to a term in the table.
Complete step-by-step solution:
From the question we know the cumulative frequency of the distribution. Since the last cumulative frequency is $35$ the given sample has the weight of total $35$ students.
Now, we have to plot the graph with taking the upper limit of weight on X-axis and the respective cumulative frequency on the Y-axis to get the less than ogive.
The points to be plotted to make a less than ogive are on the graph are: $(38,0),(40,3),(42,5),(44,9),(46,14),(48,28),(50,32),(52,35)$
The Curve in the above graph is the Cumulative Frequency Curve i.e. the ogive.
Now to find the median:
Let $N$ be the total number of students whose data is given.
Also, $N$ will be the cumulative frequency of the last interval.
We find the ${\left[ {\dfrac{N}{2}} \right]^{th}}$ item and mark it on the y-axis.
In this case the ${\left[ {\dfrac{N}{2}} \right]^{th}}$ item is $(35/2)$ = $17.5$ student.
We draw a perpendicular from $17.5$ to the right to cut the Ogive curve.
From where the Ogive curve is cut, draw a perpendicular on the x-axis. The point at which it touches the x-axis will be the median value of the series as shown in the graph:
$\therefore $ From the above Graph we can see that the median is almost $47$ which is the required answer.
Note: The cumulative frequency should always be plotted on the Y-axis to get a correct ogive.
This was an example of a less than ogive, there also exists a more than ogive, in this type of ogive while making the cumulative frequency table, all the succeeding terms in the distribution should be added to a term in the table.
Recently Updated Pages
Master Class 12 Economics: Engaging Questions & Answers for Success
Master Class 12 English: Engaging Questions & Answers for Success
Master Class 12 Social Science: Engaging Questions & Answers for Success
Master Class 12 Maths: Engaging Questions & Answers for Success
Master Class 12 Physics: Engaging Questions & Answers for Success
Master Class 11 Social Science: Engaging Questions & Answers for Success
Trending doubts
One Metric ton is equal to kg A 10000 B 1000 C 100 class 11 physics CBSE
Difference Between Prokaryotic Cells and Eukaryotic Cells
Find the value of the expression given below sin 30circ class 11 maths CBSE
Two of the body parts which do not appear in MRI are class 11 biology CBSE
Draw a diagram of nephron and explain its structur class 11 biology CBSE
10 examples of friction in our daily life