


Find median of the following grouped data graphically?
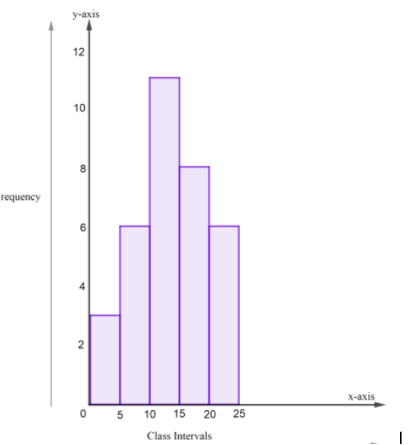
Class Interval Frequency 0-5 03 5-10 06 10-15 11 15-20 08 20-25 06
| Class Interval | Frequency |
| 0-5 | 03 |
| 5-10 | 06 |
| 10-15 | 11 |
| 15-20 | 08 |
| 20-25 | 06 |
Answer
608.7k+ views
Hint: First we will write the definition of the median in general and then we will write the given data and then we will make a more than curve and a less than curve by first making a more than cumulative frequency table and a less than cumulative frequency table, finally we will plot the obtained points and then where the two points intersect that will be our median.
Complete step by step answer:
First let’s understand the meaning of the median of a given data, so median is the middle value of the given set of data when arranged in a particular order. Now, if the number of observations in any given data is odd, therefore the median will be ${{\left( \dfrac{n+1}{2} \right)}^{th}}$term, whereas when the number of observations is even then the median will be both ${{\left( \dfrac{n}{2} \right)}^{th}}\text{ and }{{\left( \dfrac{n}{2}+1 \right)}^{th}}$ observations.
So, let’s consider the data given to us:
Graphical representation for above data will look like the following figure:
Similarly, we will form less than cumulative frequency table, that means we will take the upper limit of every class and see what is the total frequency present before that, which will be our cumulative frequency:
We will now plot these cumulative frequencies on a graph and form a more than curve and a less than curve and we know that the point where more than and less than curves meet then that will be our median.
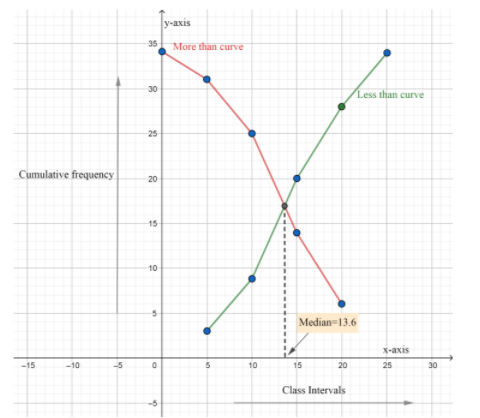
As, we see from the graph that more than and less than curve meets at 13.6 therefore, the median is 13.6
Note: Since, it is a grouped data conventional formula for median is not applied. For calculating the median of a grouped data, following formula is applied:
$\text{Median}=L+\dfrac{\left( \dfrac{n}{2} \right)-B}{G}\times w$
Where, L is the lower class boundary of the group containing the median, n is the total number of values, B is the cumulative frequency of the groups before the median group, G is the frequency of the median group and w is the group width.
Complete step by step answer:
First let’s understand the meaning of the median of a given data, so median is the middle value of the given set of data when arranged in a particular order. Now, if the number of observations in any given data is odd, therefore the median will be ${{\left( \dfrac{n+1}{2} \right)}^{th}}$term, whereas when the number of observations is even then the median will be both ${{\left( \dfrac{n}{2} \right)}^{th}}\text{ and }{{\left( \dfrac{n}{2}+1 \right)}^{th}}$ observations.
So, let’s consider the data given to us:
| Class Interval | Frequency |
| 0-5 | 03 |
| 5-10 | 06 |
| 10-15 | 11 |
| 15-20 | 08 |
| 20-25 | 06 |
Graphical representation for above data will look like the following figure:
Similarly, we will form less than cumulative frequency table, that means we will take the upper limit of every class and see what is the total frequency present before that, which will be our cumulative frequency:
| Class Interval | Cumulative Frequency |
| Less than 5 | 3 |
| Less than 10 | 9 |
| Less than 15 | 20 |
| Less than 20 | 28 |
| Less than 25 | 34 |
We will now plot these cumulative frequencies on a graph and form a more than curve and a less than curve and we know that the point where more than and less than curves meet then that will be our median.
As, we see from the graph that more than and less than curve meets at 13.6 therefore, the median is 13.6
Note: Since, it is a grouped data conventional formula for median is not applied. For calculating the median of a grouped data, following formula is applied:
$\text{Median}=L+\dfrac{\left( \dfrac{n}{2} \right)-B}{G}\times w$
Where, L is the lower class boundary of the group containing the median, n is the total number of values, B is the cumulative frequency of the groups before the median group, G is the frequency of the median group and w is the group width.
Recently Updated Pages
Master Class 12 Business Studies: Engaging Questions & Answers for Success
Master Class 12 Biology: Engaging Questions & Answers for Success
Master Class 12 Chemistry: Engaging Questions & Answers for Success
Class 12 Question and Answer - Your Ultimate Solutions Guide
Master Class 11 Social Science: Engaging Questions & Answers for Success
Master Class 11 English: Engaging Questions & Answers for Success
Trending doubts
Which are the Top 10 Largest Countries of the World?
Draw a labelled sketch of the human eye class 12 physics CBSE
Name the crygenes that control cotton bollworm and class 12 biology CBSE
Differentiate between homogeneous and heterogeneous class 12 chemistry CBSE
Ribosomal RNA is actively synthesised in A Nucleoplasm class 12 biology CBSE
How many molecules of ATP and NADPH are required information class 12 biology CBSE