


Explain how to graph sinusoidal functions.
Answer
574.2k+ views
Hint: A sinusoidal function is a function which consists of a smooth and repetitive oscillation. It comes from “sine”, as the sine function is also a smooth and repetitive oscillation. There are many everyday things which can be represented by this function. For example, a vibrating guitar string, a bouncing spring, swinging pendulum etc.
Complete step-by-step answer:
To graph sinusoidal functions there is a standard form i.e,
\[y = A\sin \left( {\dfrac{{2\pi }}{B}(x - C) + D} \right)\]
Where, A, B, C, D are constants and if these constants are specified then we can draw an accurate graph easily.
From the equation$y = D$, draw a horizontal line, this line divides the graph\[y = A\sin \left( {\dfrac{{2\pi }}{B}(x - C) + D} \right)\] symmetrically.
From the equation, $y = D + A$, draw a horizontal line and on this line the maximum value will lie and from the equation $y = D - A$, draw a horizontal line and on this line the minimum value will lie.
The distance between the two successive maxima and the two successive minima is termed as the period B. Therefore, the distance between the maxima and the minima is $\dfrac{1}{2}B$.
Now, plot the point $(C,D)$and now there are three places in the graph which crosses the mean line i.e, $\left( {C,D} \right),\left( {C + \dfrac{1}{2}B,D} \right),\left( {C + B,D} \right)$.
Between the point $\left( {C,D} \right)$and$\left( {C + \dfrac{1}{2}B,D} \right)$, there is a maxima at point $\left( {C + \dfrac{1}{4}B,D + A} \right)$. Similarly, there is a minima i.e. $\left( {C + \dfrac{3}{4}B,D - A} \right)$, between the point $\left( {C + \dfrac{1}{2}B,D} \right)$ and$\left( {C + B,D} \right)$. The sinusoidal graph is indicated as,
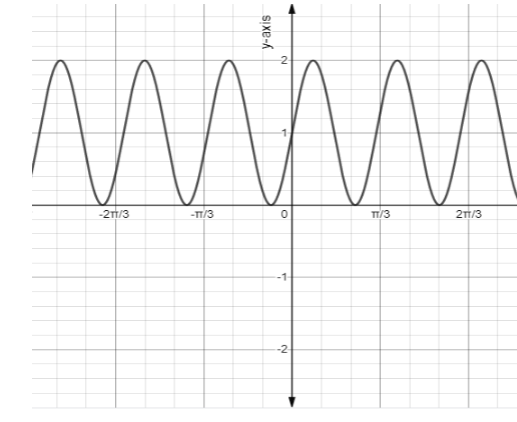
Note: On the domain$C \leqslant x \leqslant C + B$, we can graph sinusoidal functions by connecting the points that are described. Once we know, the part of a graph, it shows that the function is periodic and the pattern repeats at intervals i.e, $C + B \leqslant x \leqslant C + 2B,C - B \leqslant x \leqslant C,$etc.
Complete step-by-step answer:
To graph sinusoidal functions there is a standard form i.e,
\[y = A\sin \left( {\dfrac{{2\pi }}{B}(x - C) + D} \right)\]
Where, A, B, C, D are constants and if these constants are specified then we can draw an accurate graph easily.
From the equation$y = D$, draw a horizontal line, this line divides the graph\[y = A\sin \left( {\dfrac{{2\pi }}{B}(x - C) + D} \right)\] symmetrically.
From the equation, $y = D + A$, draw a horizontal line and on this line the maximum value will lie and from the equation $y = D - A$, draw a horizontal line and on this line the minimum value will lie.
The distance between the two successive maxima and the two successive minima is termed as the period B. Therefore, the distance between the maxima and the minima is $\dfrac{1}{2}B$.
Now, plot the point $(C,D)$and now there are three places in the graph which crosses the mean line i.e, $\left( {C,D} \right),\left( {C + \dfrac{1}{2}B,D} \right),\left( {C + B,D} \right)$.
Between the point $\left( {C,D} \right)$and$\left( {C + \dfrac{1}{2}B,D} \right)$, there is a maxima at point $\left( {C + \dfrac{1}{4}B,D + A} \right)$. Similarly, there is a minima i.e. $\left( {C + \dfrac{3}{4}B,D - A} \right)$, between the point $\left( {C + \dfrac{1}{2}B,D} \right)$ and$\left( {C + B,D} \right)$. The sinusoidal graph is indicated as,
Note: On the domain$C \leqslant x \leqslant C + B$, we can graph sinusoidal functions by connecting the points that are described. Once we know, the part of a graph, it shows that the function is periodic and the pattern repeats at intervals i.e, $C + B \leqslant x \leqslant C + 2B,C - B \leqslant x \leqslant C,$etc.
Recently Updated Pages
Master Class 12 Economics: Engaging Questions & Answers for Success
Master Class 12 English: Engaging Questions & Answers for Success
Master Class 12 Social Science: Engaging Questions & Answers for Success
Master Class 12 Maths: Engaging Questions & Answers for Success
Master Class 12 Physics: Engaging Questions & Answers for Success
Master Class 9 General Knowledge: Engaging Questions & Answers for Success
Trending doubts
One Metric ton is equal to kg A 10000 B 1000 C 100 class 11 physics CBSE
Difference Between Prokaryotic Cells and Eukaryotic Cells
Two of the body parts which do not appear in MRI are class 11 biology CBSE
Find the value of the expression given below sin 30circ class 11 maths CBSE
1 ton equals to A 100 kg B 1000 kg C 10 kg D 10000 class 11 physics CBSE
Draw a diagram of nephron and explain its structur class 11 biology CBSE