


Draw the Venn Diagram of \[A\cap B.\]
Answer
623.7k+ views
Hint: To solve the given question, we will first find out what is the meaning of \[A\cap B.\] After doing this, we will find the meaning of a Venn diagram and what they are used for. Then, to draw the Venn diagram of \[A\cap B,\] we will draw a rectangle and two circles in it which are intersecting at two points. Then, we will shade the common area to both circles. This shaded area will represent \[A\cap B.\]
Complete step-by-step answer:
Before we start solving the given question, we need to know some basic concepts about the set and some of the operations on two sets. A set is basically a collection of well – defined and distinct objects. In our question, A and B are two sets and the operation performed between them is \['\cap '\] which is called the intersection of the sets. Thus, \[A\cap B\] means A intersection B. In simple words, it defines those elements or objects which are common to both the sets A and B. Now, we have to Venn Diagram of \[A\cap B.\] A Venn diagram is a diagram representing mathematical or logical sets pictorially as circles or closed curves within an enclosing rectangle. In our case, the two circles which we are going to draw will represent A and B. The common area of both the circles will represent \[A\cap B.\] Thus, the Venn diagram of \[A\cap B\] is given as
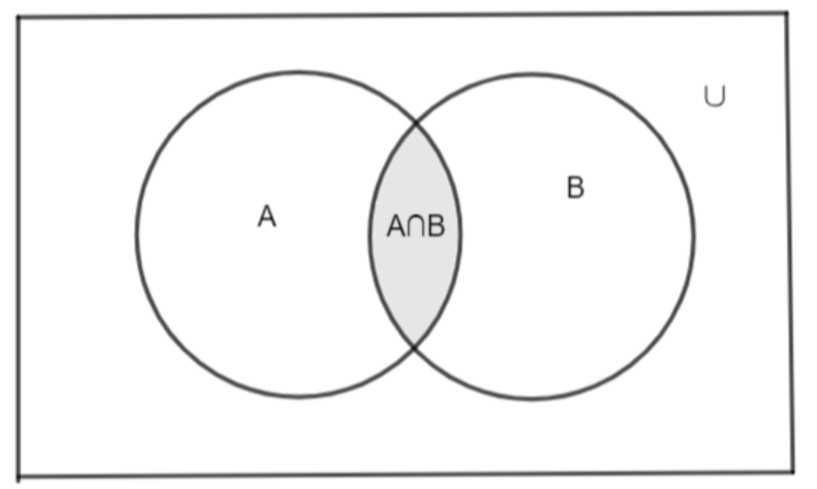
In the above diagram, the shaded region represents \[A\cap B.\]
Note: It is necessary to shade the region which we want to represent in the Venn diagram. If we want to show some other operation of sets on the Venn diagram, then we will have to shade some other portion of the Venn diagram.
Complete step-by-step answer:
Before we start solving the given question, we need to know some basic concepts about the set and some of the operations on two sets. A set is basically a collection of well – defined and distinct objects. In our question, A and B are two sets and the operation performed between them is \['\cap '\] which is called the intersection of the sets. Thus, \[A\cap B\] means A intersection B. In simple words, it defines those elements or objects which are common to both the sets A and B. Now, we have to Venn Diagram of \[A\cap B.\] A Venn diagram is a diagram representing mathematical or logical sets pictorially as circles or closed curves within an enclosing rectangle. In our case, the two circles which we are going to draw will represent A and B. The common area of both the circles will represent \[A\cap B.\] Thus, the Venn diagram of \[A\cap B\] is given as
In the above diagram, the shaded region represents \[A\cap B.\]
Note: It is necessary to shade the region which we want to represent in the Venn diagram. If we want to show some other operation of sets on the Venn diagram, then we will have to shade some other portion of the Venn diagram.
Recently Updated Pages
Master Class 11 Social Science: Engaging Questions & Answers for Success
Master Class 11 English: Engaging Questions & Answers for Success
Master Class 11 Maths: Engaging Questions & Answers for Success
Master Class 11 Chemistry: Engaging Questions & Answers for Success
Master Class 11 Biology: Engaging Questions & Answers for Success
Master Class 11 Physics: Engaging Questions & Answers for Success
Trending doubts
One Metric ton is equal to kg A 10000 B 1000 C 100 class 11 physics CBSE
Difference Between Prokaryotic Cells and Eukaryotic Cells
How many of the following diseases can be studied with class 11 biology CBSE
Two of the body parts which do not appear in MRI are class 11 biology CBSE
Which of the following enzymes is used for carboxylation class 11 biology CBSE
Explain zero factorial class 11 maths CBSE