


Draw the histogram for the following frequency distribution .
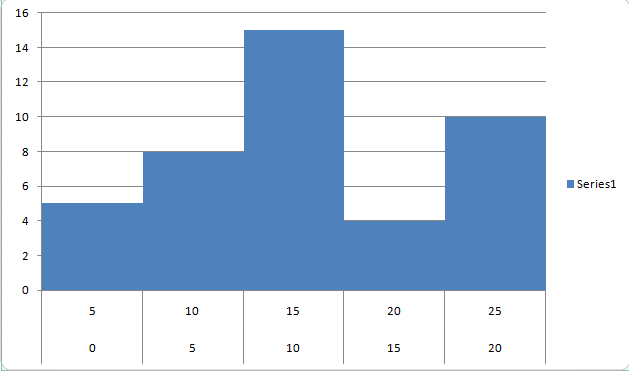
Class - Interval Frequency $0 - 5$ $5$ $5 - 10$ $8$ $10 - 15$ $15$ $15 - 20$ $4$ $20 - 25$ $10$
| Class - Interval | Frequency |
| $0 - 5$ | $5$ |
| $5 - 10$ | $8$ |
| $10 - 15$ | $15$ |
| $15 - 20$ | $4$ |
| $20 - 25$ | $10$ |
Answer
577.5k+ views
Hint:
A histogram is a bar graph-like representation of data that buckets a range of outcomes into columns along the x-axis and in the y-axis represents the number count or percentage of occurrences in the data for each column and can be used to visualize data distributions in bar graph there is having space between them while in histogram no space will occur.
Complete step by step solution:
A histogram is a bar graph which shows frequency distributions among the given data
For drawing the histogram, First on the vertical axis or the Y- axis , place the frequencies of the given data . Label this axis as "Frequency". Then on the horizontal axis or the X - axis , Place the lower value of each interval Now label this axis with the type of data shown as class interval. Draw a bar extending from the lower value of each interval to the lower value of the next interval. The height of each bar should be equal to the frequency of its corresponding interval.
So on following these steps the histogram will look like
Note:
There are many types of chart for example pie chart , Bar chart ,Line chart , Area chart etc
For comparing the frequencies of the given data we will use the Bar Charts for example if we have to compare that Runs scored by a batsmen in the following years so we make the bar chart of the Batsman runs vs. year from here we will compare easily .
A line chart is a graphical representation of an asset's historical price action that connects a series of data points with a continuous line.
Recently Updated Pages
Master Class 10 Computer Science: Engaging Questions & Answers for Success
Master Class 10 General Knowledge: Engaging Questions & Answers for Success
Master Class 10 English: Engaging Questions & Answers for Success
Master Class 10 Social Science: Engaging Questions & Answers for Success
Master Class 10 Maths: Engaging Questions & Answers for Success
Master Class 10 Science: Engaging Questions & Answers for Success
Trending doubts
Which women's tennis player has 24 Grand Slam singles titles?
Who is the Brand Ambassador of Incredible India?
Why is there a time difference of about 5 hours between class 10 social science CBSE
The Equation xxx + 2 is Satisfied when x is Equal to Class 10 Maths
Which Country is Called "The Land of Festivals"?
What is Contraception List its four different methods class 10 biology CBSE