


Draw the graph of the equation $y=x+2$.
Answer
587.7k+ views
Hint: The above given question is a graph of linear equations . To draw the line given above we will first find a minimum three points which lie on the line and then we will plot all those points on the graph and then join these points with the help of the ruler. The line which we have obtained will be the graph of $y=x+2$.
Complete step-by-step solution:
We know that the above question is a linear equation.
Since, we have to draw the graph of the equation $y=x+2$so will at first find the minimum three points which lie on the given line equation.
Since, we know that $y=x+2$, so when x = 0, we will get:
$\begin{align}
& \Rightarrow y=0+2 \\
& \Rightarrow y=2 \\
\end{align}$
Now, when y = 0, we will get:
$\begin{align}
& \Rightarrow 0=x+2 \\
& \Rightarrow x=-2 \\
\end{align}$
Now, when x = 1,we will get:
$\begin{align}
& \Rightarrow y=1+2 \\
& \Rightarrow y=3 \\
\end{align}$
So, we will arrange the above value y corresponding to different value of x in the below table:
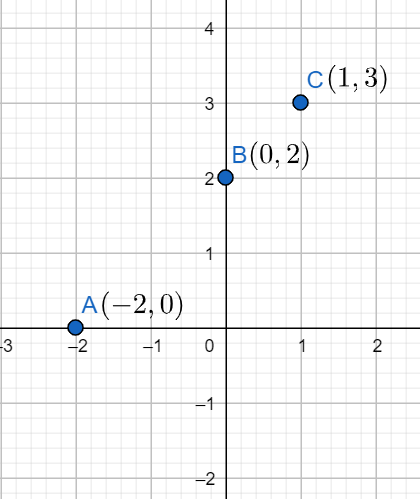
Now, we will plot all the above point on the graph, we will get:
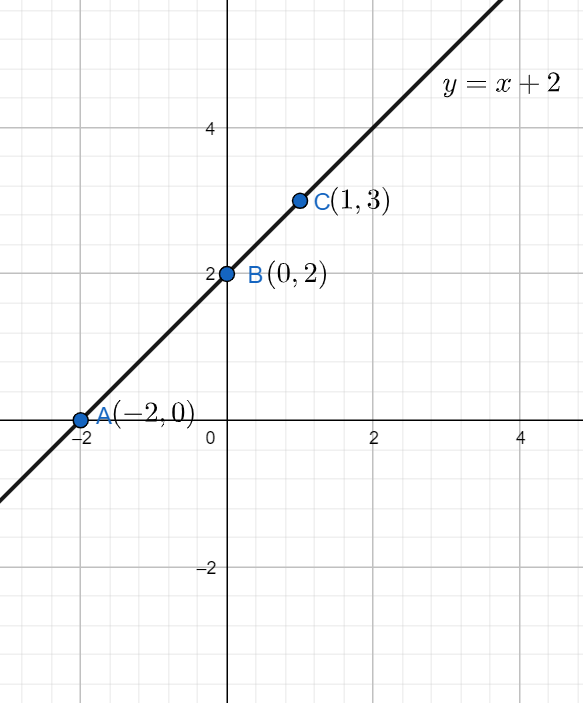
Now, to get the graph of $y=x+2$ we will join all the plotted points with the help of a ruler.
Thus, the line which we obtain after joining all the points is our required graph.
This is our required solution.
Note: Student are required to note that in $y=x+2$, we have coefficient of y is 1, so coefficient of x is equal to slope of the given line because the general equation of the slope-intercept form of the line is given as y = mx + c, where m is the slope of the line and c is the y-intercept of the line.
Complete step-by-step solution:
We know that the above question is a linear equation.
Since, we have to draw the graph of the equation $y=x+2$so will at first find the minimum three points which lie on the given line equation.
Since, we know that $y=x+2$, so when x = 0, we will get:
$\begin{align}
& \Rightarrow y=0+2 \\
& \Rightarrow y=2 \\
\end{align}$
Now, when y = 0, we will get:
$\begin{align}
& \Rightarrow 0=x+2 \\
& \Rightarrow x=-2 \\
\end{align}$
Now, when x = 1,we will get:
$\begin{align}
& \Rightarrow y=1+2 \\
& \Rightarrow y=3 \\
\end{align}$
So, we will arrange the above value y corresponding to different value of x in the below table:
| x | -2 | 0 | 1 |
| y | 0 | 2 | 3 |
Now, we will plot all the above point on the graph, we will get:
Now, to get the graph of $y=x+2$ we will join all the plotted points with the help of a ruler.
Thus, the line which we obtain after joining all the points is our required graph.
This is our required solution.
Note: Student are required to note that in $y=x+2$, we have coefficient of y is 1, so coefficient of x is equal to slope of the given line because the general equation of the slope-intercept form of the line is given as y = mx + c, where m is the slope of the line and c is the y-intercept of the line.
Recently Updated Pages
Master Class 11 English: Engaging Questions & Answers for Success
Master Class 11 Maths: Engaging Questions & Answers for Success
Class 11 Question and Answer - Your Ultimate Solutions Guide
Master Class 11 Biology: Engaging Questions & Answers for Success
Master Class 11 Physics: Engaging Questions & Answers for Success
Master Class 11 Accountancy: Engaging Questions & Answers for Success
Trending doubts
Explain the Treaty of Vienna of 1815 class 10 social science CBSE
Who Won 36 Oscar Awards? Record Holder Revealed
What is the median of the first 10 natural numbers class 10 maths CBSE
Why is it 530 pm in india when it is 1200 afternoon class 10 social science CBSE
Select the word that is correctly spelled a Twelveth class 10 english CBSE
Why is there a time difference of about 5 hours between class 10 social science CBSE