


Draw an ogive for the following frequency distribution by less than type method and also find its median from the graph.
Marks \[0 - 10\] \[10 - 20\] \[20 - 30\] \[30 - 40\] \[40 - 50\] \[50 - 60\] Number of students 7 10 23 51 6 3
| Marks | \[0 - 10\] | \[10 - 20\] | \[20 - 30\] | \[30 - 40\] | \[40 - 50\] | \[50 - 60\] |
| Number of students | 7 | 10 | 23 | 51 | 6 | 3 |
Answer
603k+ views
Hint: To draw an ogive, we have to find the cumulative frequency of less than type at each interval and then plot a graph between the cumulative frequencies with the marks. Once we have plotted the ogive of less than type, we need to find the half of cumulative frequency and find the corresponding marks at that point from the graph. The value of marks at that point will be the median for the data.
Complete step-by-step answer:
First of all we will find the cumulative frequencies at each interval and organize them in the form of a table. The table will have three columns as marks, frequencies and cumulative frequency.
Thus, the table formed is
Now, we can easily plot a graph between the marks and the cumulative frequencies to get a less than type ogive for the data.
The graph plotted is as follows
Now, to find the median from this graph, first we will have to find the half of the cumulative frequency, which will be given as \[\dfrac{n}{2} = \dfrac{{100}}{2} = 50\], where \[n\] is the total cumulative frequency. Thus, we need to find the marks on the graph which correspond to a cumulative frequency of 50.
By observing the graph we can easily say that the median is approximately 32.
Hence the median for this data will be 32.
Note: While drawing a less than ogive, we plot the cumulative frequency at an interval with the upper limit of that interval, as it is less than type ogive, which means the frequencies of those marks which are less than the upper limit of the interval.
Complete step-by-step answer:
First of all we will find the cumulative frequencies at each interval and organize them in the form of a table. The table will have three columns as marks, frequencies and cumulative frequency.
Thus, the table formed is
| Marks | Frequency | Cumulative frequency (less than) |
| \[0 - 10\] | 7 | 7 |
| \[10 - 20\] | 10 | 17 |
| \[20 - 30\] | 23 | 40 |
| \[30 - 40\] | 51 | 91 |
| \[40 - 50\] | 6 | 97 |
| \[50 - 60\] | 3 | 100 |
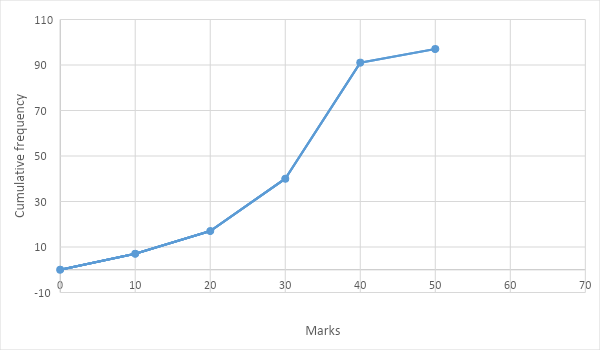
Now, we can easily plot a graph between the marks and the cumulative frequencies to get a less than type ogive for the data.
The graph plotted is as follows
Now, to find the median from this graph, first we will have to find the half of the cumulative frequency, which will be given as \[\dfrac{n}{2} = \dfrac{{100}}{2} = 50\], where \[n\] is the total cumulative frequency. Thus, we need to find the marks on the graph which correspond to a cumulative frequency of 50.
By observing the graph we can easily say that the median is approximately 32.
Hence the median for this data will be 32.
Note: While drawing a less than ogive, we plot the cumulative frequency at an interval with the upper limit of that interval, as it is less than type ogive, which means the frequencies of those marks which are less than the upper limit of the interval.
Recently Updated Pages
Master Class 12 Business Studies: Engaging Questions & Answers for Success
Master Class 12 Biology: Engaging Questions & Answers for Success
Master Class 12 Chemistry: Engaging Questions & Answers for Success
Class 12 Question and Answer - Your Ultimate Solutions Guide
Master Class 11 Social Science: Engaging Questions & Answers for Success
Master Class 11 English: Engaging Questions & Answers for Success
Trending doubts
Explain the Treaty of Vienna of 1815 class 10 social science CBSE
Which Indian city is known as the "City of Victory"?
Which instrument is used to measure the Blood Pressure?
Who Won 36 Oscar Awards? Record Holder Revealed
What is the median of the first 10 natural numbers class 10 maths CBSE
Why is it 530 pm in india when it is 1200 afternoon class 10 social science CBSE