


How can I draw a velocity vector diagram?
Answer
603.3k+ views
Hint: Velocity diagrams are the diagrams that use a vector arrow to indicate the direction and the relative magnitude of a vector quantity. To define the velocity of a moving object during the phase, vector diagrams may be used. For instance to depict the motion of a car going down the road, a vector diagram may be used.
Complete answer:
The magnitude of a vector quantity is expressed by the scale of the vector arrow in a vector diagram if the arrow size is the same in each consecutive frame of the vector diagram, then the vector magnitude is constant. The diagram below shows a car's speeds during its motion. The scale of the velocity vector is constant in the top diagram so the diagram represents a motion of the constant velocity. The velocity vector size is increasing in the bottom diagram as we see one example.
Let's understand the velocity diagram with the example.
Assume that a bus is travelling at the velocity of the 70km/h.
After that bus turns in east and continues at the reduce speed of 50km/h
Now let’s check what resultant velocity is,
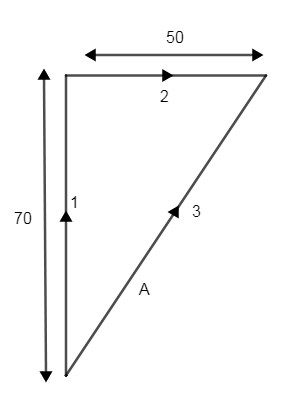
As we can see from the figure the first vector shown as line 1 which has speed of 70km/h and the second vector is shown as line 2 and ‘A’ vector is a resultant vector of the both speed of the line 1 and 2
This is how we can draw vector diagrams.
Note:
As an approach to solve this question first we have seen a definition of the velocity diagram which states that the velocity diagram can be used to describe the velocity of a moving object during its motion as we have seen by an example of the bus.
Complete answer:
The magnitude of a vector quantity is expressed by the scale of the vector arrow in a vector diagram if the arrow size is the same in each consecutive frame of the vector diagram, then the vector magnitude is constant. The diagram below shows a car's speeds during its motion. The scale of the velocity vector is constant in the top diagram so the diagram represents a motion of the constant velocity. The velocity vector size is increasing in the bottom diagram as we see one example.
Let's understand the velocity diagram with the example.
Assume that a bus is travelling at the velocity of the 70km/h.
After that bus turns in east and continues at the reduce speed of 50km/h
Now let’s check what resultant velocity is,
As we can see from the figure the first vector shown as line 1 which has speed of 70km/h and the second vector is shown as line 2 and ‘A’ vector is a resultant vector of the both speed of the line 1 and 2
This is how we can draw vector diagrams.
Note:
As an approach to solve this question first we have seen a definition of the velocity diagram which states that the velocity diagram can be used to describe the velocity of a moving object during its motion as we have seen by an example of the bus.
Recently Updated Pages
Master Class 10 Computer Science: Engaging Questions & Answers for Success
Master Class 10 Social Science: Engaging Questions & Answers for Success
Master Class 10 Science: Engaging Questions & Answers for Success
Class 10 Question and Answer - Your Ultimate Solutions Guide
Master Class 10 Maths: Engaging Questions & Answers for Success
Master Class 10 English: Engaging Questions & Answers for Success
Trending doubts
Difference Between Prokaryotic Cells and Eukaryotic Cells
Two of the body parts which do not appear in MRI are class 11 biology CBSE
10 examples of friction in our daily life
Draw a diagram of nephron and explain its structur class 11 biology CBSE
One Metric ton is equal to kg A 10000 B 1000 C 100 class 11 physics CBSE
Draw a diagram of a plant cell and label at least eight class 11 biology CBSE