


Draw a pie chart for the following data.
Items of expenditure Food Health Clothing Education Savings
Amount spent in rupees $3750$ $1875$ $1875$ $1200$ $7500$
Answer
591.3k+ views
Hint:
To draw a pie chart, we will first categorize the data and then we will calculate the total amount spent in rupees and then we will divide the data of each category by the total amount spent. We will multiply each fraction with ${{360}^{\circ }}$ to convert the fraction into angles. We will use the obtained angle for each category to draw the pie chart. For that, we will first draw a circle of any radius and then we will draw a horizontal radius in that circle and we will start drawing the angles for each category using that horizontal radius and after drawing all the angles, we will get the pie chart.
Complete step by step solution:
First we will draw a table and categorize the data and we will enter the data into the table.
Now, we will add the amount spent on each item.
Therefore,
Total amount $=3750+1875+1875+1200+7500$
We will add all the numbers now.
So, total amount is equal to $16200$
Now, we will divide the amount of each item by the total amount and redraw the table.
Now we will multiply each fraction with $360^{\circ}$ to convert all the fractions into angles.
Now, we will simplify each value.
We have calculated all the angles. Let’s start drawing the pie chart now.
For that we will first draw a circle of any radius and then we will draw a radius which will be horizontal.
Then we will construct all the angles one by one. For the first angle we will take that horizontal radius as the base and draw the angle ${{83.4}^{\circ }}$ and then we will draw the next angle taking the second radius as the base and so on. Let’s draw the pie chart now.
This is the required pie chart.
Note:
Since we have used pie graphs here. So let’s define it first. A pie graph is defined as a graph that represents the data in a circular graph. Each category of the data is represented by the slice of the pie chart. All the slices that represent each category add to form the complete circular chart i.e. a pie chart.
To draw a pie chart, we will first categorize the data and then we will calculate the total amount spent in rupees and then we will divide the data of each category by the total amount spent. We will multiply each fraction with ${{360}^{\circ }}$ to convert the fraction into angles. We will use the obtained angle for each category to draw the pie chart. For that, we will first draw a circle of any radius and then we will draw a horizontal radius in that circle and we will start drawing the angles for each category using that horizontal radius and after drawing all the angles, we will get the pie chart.
Complete step by step solution:
First we will draw a table and categorize the data and we will enter the data into the table.
| Items of expenditure | Food | Health | Clothing | Education | Savings |
| Amount spent in rupees | 3750 | 1875 | 1875 | 1200 | 7500 |
Now, we will add the amount spent on each item.
Therefore,
Total amount $=3750+1875+1875+1200+7500$
We will add all the numbers now.
So, total amount is equal to $16200$
Now, we will divide the amount of each item by the total amount and redraw the table.
| Items of expenditure | Food | Health | Clothing | Education | Savings |
| Amount spent in rupees | $\dfrac{3750}{16200}$ | $\dfrac{1875}{16200}$ | \[\dfrac{1875}{16200}\] | $\dfrac{1200}{16200}$ | $\dfrac{7500}{16200}$ |
Now we will multiply each fraction with $360^{\circ}$ to convert all the fractions into angles.
| Items of expenditure | Food | Health | Clothing | Education | Savings |
| Amount spent | $\dfrac{3750}{16200}\times {{360}^{\circ }}$ | $\dfrac{1875}{16200}\times {{360}^{\circ }}$ | $\dfrac{1875}{16200}\times {{360}^{\circ }}$ | $\dfrac{1200}{16200}\times {{360}^{\circ }}$ | $\dfrac{7500}{16200}\times {{360}^{\circ }}$ |
Now, we will simplify each value.
| Items of expenditure | Food | Health | Clothing | Education | Savings |
| Amount spent | \[{{83.4}^{\circ }}\] | ${{41.6}^{\circ }}$ | ${{41.6}^{\circ }}$ | ${{26.7}^{\circ }}$ | ${{166.7}^{\circ }}$ |
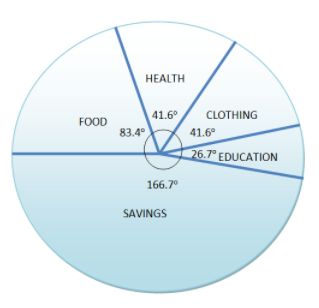
We have calculated all the angles. Let’s start drawing the pie chart now.
For that we will first draw a circle of any radius and then we will draw a radius which will be horizontal.
Then we will construct all the angles one by one. For the first angle we will take that horizontal radius as the base and draw the angle ${{83.4}^{\circ }}$ and then we will draw the next angle taking the second radius as the base and so on. Let’s draw the pie chart now.
This is the required pie chart.
Note:
Since we have used pie graphs here. So let’s define it first. A pie graph is defined as a graph that represents the data in a circular graph. Each category of the data is represented by the slice of the pie chart. All the slices that represent each category add to form the complete circular chart i.e. a pie chart.
Recently Updated Pages
In a plane electromagnetic wave the electric field class 12 physics CBSE
A plane electromagnetic wave travels in vacuum along class 12 physics CBSE
The magnetic field in a plane electromagnetic wave class 11 physics CBSE
Basicity of sulphurous acid and sulphuric acid are
Master Class 10 English: Engaging Questions & Answers for Success
Master Class 10 Social Science: Engaging Questions & Answers for Success
Trending doubts
Which country won the ICC Men's ODI World Cup in 2023?
What is the full form of PNG A Petrol Natural Gas B class 10 chemistry CBSE
In cricket, how many legal balls are there in a standard over?
Explain the Treaty of Vienna of 1815 class 10 social science CBSE
What does "powerplay" mean in limited-overs cricket?
What is the "Powerplay" in T20 cricket?