


Draw a histogram for the adjacent data.
Class interval 0-9 10-14 15-24 25-29 30-34 Frequency 6 4 12 10 8
| Class interval | 0-9 | 10-14 | 15-24 | 25-29 | 30-34 |
| Frequency | 6 | 4 | 12 | 10 | 8 |
Answer
587.1k+ views
Hint: We start solving the problem by checking whether the given data for the histogram is continuous or not. If the given data is continuous, we use that original data to draw the histogram otherwise we add the correction to the upper and lower boundaries of each class interval. We then draw the histogram after making corrections to the given data as mentioned above.
Complete step by step answer:
According to the problem, we need to draw the histogram for the given data as shown in the table below.
We can see that the upper boundary of the previous interval is not equal to the lower boundary of next interval which makes it not continuous. So, we need to add correction 0.5 to each upper boundary and subtract correction 0.5 to each lower boundary to make them continuous.
Now, let's rewrite the distribution table after making corrections.
Here we have taken zero as there is no significance for the negative lower boundary of a class interval.
Now, let us draw a histogram for the obtained data as shown in the table.
Let us assume the scale for the histogram be as follows:
1 cm on y-axis = 2 units of frequency.
So, the required histogram is
Note:
We should confuse histogram with the bar graph as both look equivalent. We should note that the only difference between a bar graph and histogram is that there will be no gaps between bars in histogram whereas the bars in bar graphs have some gap between them. Histogram gives a better view for a given data than any many other graphs or charts. Similarly, we can expect problems to draw the bar graph and find the mean, median and mode for the given data.
Complete step by step answer:
According to the problem, we need to draw the histogram for the given data as shown in the table below.
| Class interval | 0-9 | 10-14 | 15-24 | 25-29 | 30-34 |
| Frequency | 6 | 4 | 12 | 10 | 8 |
We can see that the upper boundary of the previous interval is not equal to the lower boundary of next interval which makes it not continuous. So, we need to add correction 0.5 to each upper boundary and subtract correction 0.5 to each lower boundary to make them continuous.
Now, let's rewrite the distribution table after making corrections.
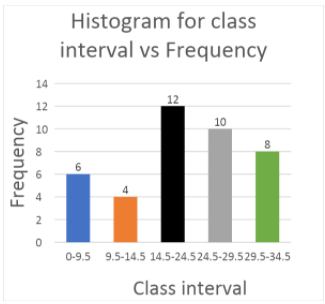
| Class interval | 0-9.5 | 9.5-14.5 | 14.5-24.5 | 24.5-29.5 | 29.5-34.5 |
| Frequency | 6 | 4 | 12 | 10 | 8 |
Here we have taken zero as there is no significance for the negative lower boundary of a class interval.
Now, let us draw a histogram for the obtained data as shown in the table.
Let us assume the scale for the histogram be as follows:
1 cm on y-axis = 2 units of frequency.
So, the required histogram is
Note:
We should confuse histogram with the bar graph as both look equivalent. We should note that the only difference between a bar graph and histogram is that there will be no gaps between bars in histogram whereas the bars in bar graphs have some gap between them. Histogram gives a better view for a given data than any many other graphs or charts. Similarly, we can expect problems to draw the bar graph and find the mean, median and mode for the given data.
Recently Updated Pages
Basicity of sulphurous acid and sulphuric acid are
Master Class 12 English: Engaging Questions & Answers for Success
Master Class 12 Social Science: Engaging Questions & Answers for Success
Master Class 12 Maths: Engaging Questions & Answers for Success
Master Class 12 Economics: Engaging Questions & Answers for Success
Master Class 12 Physics: Engaging Questions & Answers for Success
Trending doubts
Which are the Top 10 Largest Countries of the World?
Draw a labelled sketch of the human eye class 12 physics CBSE
Draw ray diagrams each showing i myopic eye and ii class 12 physics CBSE
Giving reasons state the signs positive or negative class 12 physics CBSE
Explain esterification reaction with the help of a class 12 chemistry CBSE
What is defined as a solenoid Depict a diagram with class 12 physics CBSE