


Draw a frequency polygon of the following data:
C 10-19 20-29 30-39 40-49 50-59 60-69 70-79 80-90 f 3 7 5 11 6 8 4 5
| C | 10-19 | 20-29 | 30-39 | 40-49 | 50-59 | 60-69 | 70-79 | 80-90 |
| f | 3 | 7 | 5 | 11 | 6 | 8 | 4 | 5 |
Answer
571.5k+ views
Hint: We first find the class intervals of equal width and the class marks for the given data series. We plot the class marks and the frequencies along the horizontal and vertical axes respectively to find the frequency polygon.
Complete step-by-step solution:
A frequency polygon is to exhibit the frequency distribution of a continuous variable. Two mutually perpendicular axes are taken for the class marks and the frequencies. They are plotted along the horizontal and vertical axes respectively.
We find the class intervals of equal width and the class marks for the given set of class limits of the continuous data.
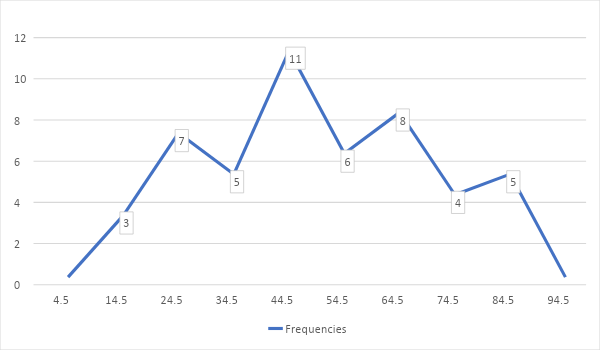
Now we draw the frequency polygon based on the frequencies and the class-marks. To get a closed polygon, we take two additional classes, one at each end which have zero frequencies.
Note: We have to be careful about the class intervals being of equal width. The changes of axes for different points are also allowed. So, we have to find the variables for the two series to place points.
Complete step-by-step solution:
A frequency polygon is to exhibit the frequency distribution of a continuous variable. Two mutually perpendicular axes are taken for the class marks and the frequencies. They are plotted along the horizontal and vertical axes respectively.
We find the class intervals of equal width and the class marks for the given set of class limits of the continuous data.
| Class-limits | Class-intervals | Class-marks | Frequencies |
| 10-19 | 9.5-19.5 | 14.5 | 3 |
| 20-29 | 19.5-29.5 | 24.5 | 7 |
| 30-39 | 29.5-39.5 | 34.5 | 5 |
| 40-49 | 39.5-49.5 | 44.5 | 11 |
| 50-59 | 49.5-59.5 | 54.5 | 6 |
| 60-69 | 59.5-69.5 | 64.5 | 8 |
| 70-79 | 69.5-79.5 | 74.5 | 4 |
| 80-90 | 79.5-89.5 | 84.5 | 5 |
Now we draw the frequency polygon based on the frequencies and the class-marks. To get a closed polygon, we take two additional classes, one at each end which have zero frequencies.
Note: We have to be careful about the class intervals being of equal width. The changes of axes for different points are also allowed. So, we have to find the variables for the two series to place points.
Recently Updated Pages
Master Class 11 English: Engaging Questions & Answers for Success
Master Class 11 Social Science: Engaging Questions & Answers for Success
Master Class 11 Maths: Engaging Questions & Answers for Success
Master Class 11 Biology: Engaging Questions & Answers for Success
Master Class 11 Physics: Engaging Questions & Answers for Success
Master Class 11 Chemistry: Engaging Questions & Answers for Success
Trending doubts
One Metric ton is equal to kg A 10000 B 1000 C 100 class 11 physics CBSE
Difference Between Prokaryotic Cells and Eukaryotic Cells
Find the value of the expression given below sin 30circ class 11 maths CBSE
Difference between physical and chemical change class 11 chemistry CBSE
Two of the body parts which do not appear in MRI are class 11 biology CBSE
Draw a diagram of a plant cell and label at least eight class 11 biology CBSE