


What does the slope of a linear regression line tell you?
Answer
533.1k+ views
Hint: For solving this question you should know about the slope of a linear regression line. As we know that the equation of a line is $y=mx+c$, here ‘m’ represents or denotes to the slope of that line and ‘x’ is the explanatory variable and the ‘y’ is the dependant variable which depends on the slope of the line and on ‘x’.
Complete step by step solution:
According to the question we have to explain about the slope of a linear regression line. As we know that the equation of a line is given by $y=mx+c$, where m is the slope of the line and c is the y-intercept. The slope of a line means to change in the y with respect to change in the 1-unit x variable. If we see an example, it will be clear to us:
Example 1. If the line equation is given as $y=5x$, then determine the slope of this line.
For solving this we will consider 3 random points. So, these points are -1, 0, 2. If we make a table for this, then:
And if we make a graph for this, then we will calculate the slope of this line.
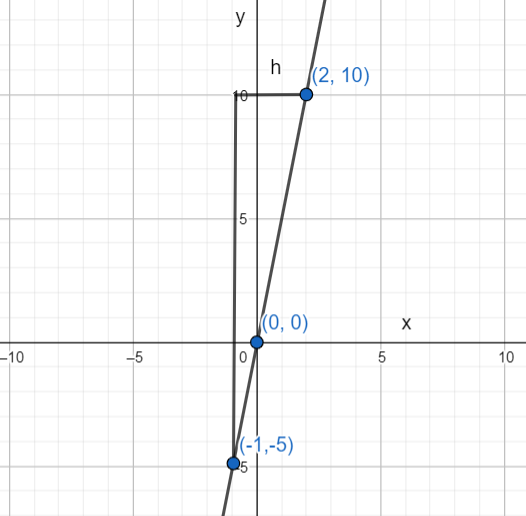
So, if we calculate the slope of this line, then,
$\tan \theta =\dfrac{{{y}_{2}}-{{y}_{1}}}{{{x}_{2}}-{{x}_{1}}}=\dfrac{10-\left( -5 \right)}{2-\left( -1 \right)}=\dfrac{15}{3}=5$
And our points are (-1, -5) and (2, 10). So, the slope for this is 5. And by this we can say that the change in y with respect to unit change in x is equal to 5.
So, the slope of a linear regression line tells us how much change in y variable is caused by a unit change in x variable.
Note: The slope of a line can be determined by the formula, but you have to be careful because if you take wrong points or if the points interchange, then your answer can be wrong and the change in y depends on the per unit change of x.
Complete step by step solution:
According to the question we have to explain about the slope of a linear regression line. As we know that the equation of a line is given by $y=mx+c$, where m is the slope of the line and c is the y-intercept. The slope of a line means to change in the y with respect to change in the 1-unit x variable. If we see an example, it will be clear to us:
Example 1. If the line equation is given as $y=5x$, then determine the slope of this line.
For solving this we will consider 3 random points. So, these points are -1, 0, 2. If we make a table for this, then:
| x | $y=5x$ |
| -1 | -5 |
| 0 | 0 |
| 2 | 10 |
And if we make a graph for this, then we will calculate the slope of this line.
So, if we calculate the slope of this line, then,
$\tan \theta =\dfrac{{{y}_{2}}-{{y}_{1}}}{{{x}_{2}}-{{x}_{1}}}=\dfrac{10-\left( -5 \right)}{2-\left( -1 \right)}=\dfrac{15}{3}=5$
And our points are (-1, -5) and (2, 10). So, the slope for this is 5. And by this we can say that the change in y with respect to unit change in x is equal to 5.
So, the slope of a linear regression line tells us how much change in y variable is caused by a unit change in x variable.
Note: The slope of a line can be determined by the formula, but you have to be careful because if you take wrong points or if the points interchange, then your answer can be wrong and the change in y depends on the per unit change of x.
Recently Updated Pages
Master Class 11 Business Studies: Engaging Questions & Answers for Success
Master Class 11 Computer Science: Engaging Questions & Answers for Success
Master Class 11 Economics: Engaging Questions & Answers for Success
Master Class 11 Social Science: Engaging Questions & Answers for Success
Master Class 11 English: Engaging Questions & Answers for Success
Master Class 11 Chemistry: Engaging Questions & Answers for Success
Trending doubts
Draw a diagram of nephron and explain its structur class 11 biology CBSE
Explain zero factorial class 11 maths CBSE
Chemical formula of Bleaching powder is A Ca2OCl2 B class 11 chemistry CBSE
One Metric ton is equal to kg A 10000 B 1000 C 100 class 11 physics CBSE
A solution of a substance X is used for white washing class 11 chemistry CBSE
Differentiate between calcination and roasting class 11 chemistry CBSE