


What does the negative slope of a velocity-time graph imply?
(A) Accelerated motion
(B) Retarded motion
(C) Uniform motion
(D) No motion
Answer
613.2k+ views
Hint
The slope of any graph gives us the fraction of its X-axis and Y-axis values. When the slope is negative, it implies that one of the quantities is decreasing as the other increases. Velocity can be calculated as the fraction of distance and time.
Complete step by step answer
A velocity-time graph has velocity on its Y-axis and time on its X-axis. It gives us a graphical representation of how the velocity increases or decreases with time. A graph has many useful attributes that tell us about new parameters that evolve from the basic axes.
For example, the area under a velocity- time graph tells us about the distance travelled by a particle in that time frame, and the area under an acceleration-time graph gives us the velocity of the body.
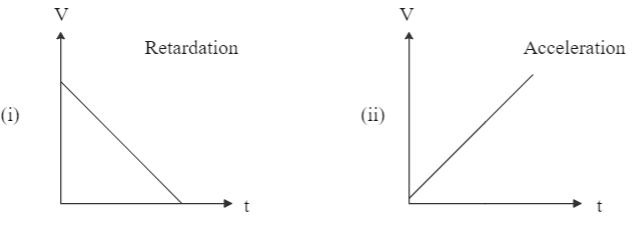
Similarly, the slope of a graph is very useful as well. For a velocity-time graph, it tells us about the acceleration of a body. When the slope is increasing (going in the upward direction) or when the velocity is increasing with time, there is a positive acceleration. But in the case of a negative slope (line moving downwards) or when the velocity is decreasing as the time increases, the acceleration is negative. This is also known as retarded motion.
Hence, the correct answer is option B: Retarded motion.
Note
Uniform motion occurs when the velocity remains constant with time. This can be identified on a graph with a line running parallel to the X-axis, assuming time is plotted on it. Thus, graphs can easily be used to identify the type of motion, even if the body keeps on changing its speed.
The slope of any graph gives us the fraction of its X-axis and Y-axis values. When the slope is negative, it implies that one of the quantities is decreasing as the other increases. Velocity can be calculated as the fraction of distance and time.
Complete step by step answer
A velocity-time graph has velocity on its Y-axis and time on its X-axis. It gives us a graphical representation of how the velocity increases or decreases with time. A graph has many useful attributes that tell us about new parameters that evolve from the basic axes.
For example, the area under a velocity- time graph tells us about the distance travelled by a particle in that time frame, and the area under an acceleration-time graph gives us the velocity of the body.
Similarly, the slope of a graph is very useful as well. For a velocity-time graph, it tells us about the acceleration of a body. When the slope is increasing (going in the upward direction) or when the velocity is increasing with time, there is a positive acceleration. But in the case of a negative slope (line moving downwards) or when the velocity is decreasing as the time increases, the acceleration is negative. This is also known as retarded motion.
Hence, the correct answer is option B: Retarded motion.
Note
Uniform motion occurs when the velocity remains constant with time. This can be identified on a graph with a line running parallel to the X-axis, assuming time is plotted on it. Thus, graphs can easily be used to identify the type of motion, even if the body keeps on changing its speed.
Recently Updated Pages
Master Class 12 Economics: Engaging Questions & Answers for Success
Master Class 12 English: Engaging Questions & Answers for Success
Master Class 12 Social Science: Engaging Questions & Answers for Success
Master Class 12 Maths: Engaging Questions & Answers for Success
Master Class 12 Physics: Engaging Questions & Answers for Success
Master Class 11 Social Science: Engaging Questions & Answers for Success
Trending doubts
One Metric ton is equal to kg A 10000 B 1000 C 100 class 11 physics CBSE
Difference Between Prokaryotic Cells and Eukaryotic Cells
Two of the body parts which do not appear in MRI are class 11 biology CBSE
1 ton equals to A 100 kg B 1000 kg C 10 kg D 10000 class 11 physics CBSE
Draw a diagram of nephron and explain its structur class 11 biology CBSE
10 examples of friction in our daily life