


Distinguish between a simple bar diagram and multiple bar diagram?
Answer
603.6k+ views
Hint:
Simple bar diagram is the type of the chart which shows the values of the different categories of data as the rectangular bars with the different lengths whereas in the multiple bar diagrams the data sets are represented by drawing the bars side by side in a cluster.
Complete step by step solution:
So basically simple and multiple bar diagrams are two types of the bar diagrams. So here the simple bar diagrams are the diagrams consisting of the bars of the equal width and the different lengths and the height of each of the bars indicate the magnitude of the item we need to represent. So a simple bar diagram is used to represent the graph which consists of the single variable classified on the spatial, quantitative or the temporal basis. In the simple chart we make the bars of the equal width but the heights are unequal depending on the item to be represented.
Let us take an example, if we take a survey of the test of the total students. So marks of the students out of $100$ will represent the bar graph as
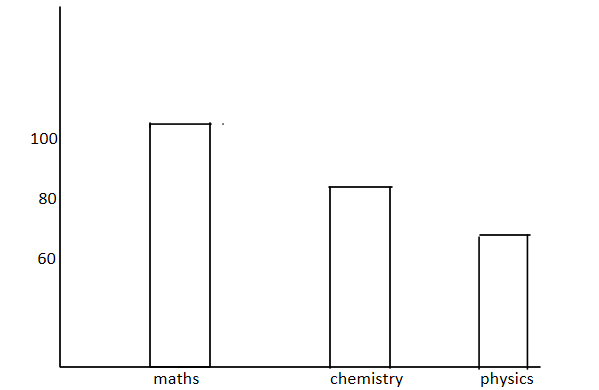
So it represents that boy obtain $100$ marks in maths, almost $90$ in chemistry, $70$ in physics
Now let us see what the multiple bar graph is. Now in these graphs, two or more sets of data are represented. A multiple bar graph compares as many sets of data as we want.
So let us take an example of the multiple bar graph.
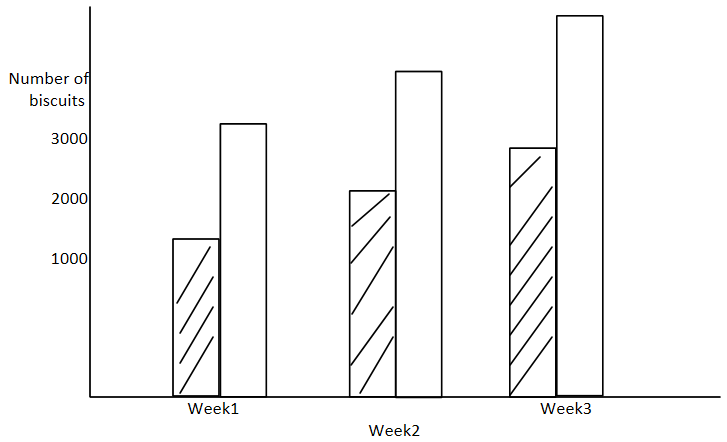
So here the two bars are drawn representing the sale of the biscuits in two different months. So there is a lot of difference between the simple and the multiple bar graphs.
Note:
So basically the bar chart or the bar graph is a chart or graph which presents categorical data with the rectangular bars with the height or the length proportional to the value they represent.
Simple bar diagram is the type of the chart which shows the values of the different categories of data as the rectangular bars with the different lengths whereas in the multiple bar diagrams the data sets are represented by drawing the bars side by side in a cluster.
Complete step by step solution:
So basically simple and multiple bar diagrams are two types of the bar diagrams. So here the simple bar diagrams are the diagrams consisting of the bars of the equal width and the different lengths and the height of each of the bars indicate the magnitude of the item we need to represent. So a simple bar diagram is used to represent the graph which consists of the single variable classified on the spatial, quantitative or the temporal basis. In the simple chart we make the bars of the equal width but the heights are unequal depending on the item to be represented.
Let us take an example, if we take a survey of the test of the total students. So marks of the students out of $100$ will represent the bar graph as
So it represents that boy obtain $100$ marks in maths, almost $90$ in chemistry, $70$ in physics
Now let us see what the multiple bar graph is. Now in these graphs, two or more sets of data are represented. A multiple bar graph compares as many sets of data as we want.
So let us take an example of the multiple bar graph.
So here the two bars are drawn representing the sale of the biscuits in two different months. So there is a lot of difference between the simple and the multiple bar graphs.
Note:
So basically the bar chart or the bar graph is a chart or graph which presents categorical data with the rectangular bars with the height or the length proportional to the value they represent.
Recently Updated Pages
Master Class 12 Business Studies: Engaging Questions & Answers for Success
Master Class 12 Biology: Engaging Questions & Answers for Success
Master Class 12 Chemistry: Engaging Questions & Answers for Success
Class 12 Question and Answer - Your Ultimate Solutions Guide
Master Class 11 Social Science: Engaging Questions & Answers for Success
Master Class 11 English: Engaging Questions & Answers for Success
Trending doubts
Explain the Treaty of Vienna of 1815 class 10 social science CBSE
Which Indian city is known as the "City of Victory"?
Which instrument is used to measure the Blood Pressure?
Who Won 36 Oscar Awards? Record Holder Revealed
What is the median of the first 10 natural numbers class 10 maths CBSE
Why is it 530 pm in india when it is 1200 afternoon class 10 social science CBSE