


How to derive the mode formula for grouped data?
Answer
615.9k+ views
Hint: To solve this question, we will first make 3 bar graphs of frequencies \[{{f}_{1}},{{f}_{2}},{{f}_{3}}.\] Mode is the value of the highest bar as that is of the maximum frequency. Finally, we will calculate the midpoint of the largest bar to get the value of the mode formula.
Complete step-by-step answer:
Let us first define the mode for grouped data. The mode of a list of data values is simply the most common values (or the values if any). When the data are grouped as in a histogram, we will normally talk only about the modal class (the class, or group with the greatest frequency) because we don’t know the individual values. The derivation of the mode formula is given by using the bar graph.
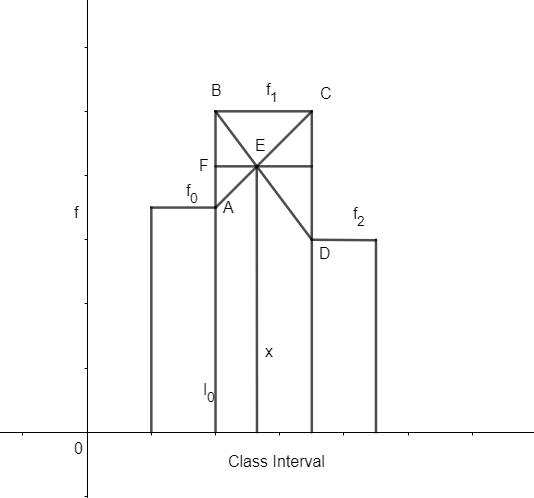
Let the frequency of the modal class be \[{{f}_{1}}.\] The frequency of the class first after the modal class is \[{{f}_{2}}.\] From the above figure, we see that, triangle AEB is similar to triangle DEC.
\[\Rightarrow \Delta AEB\sim \Delta DEC\]
The relative side ratio is also equal.
\[\Rightarrow \Delta AEB\sim \Delta DEC\]
\[\Rightarrow \dfrac{AB}{CD}=\dfrac{BE}{DE}\]
And BE is nothing but \[{{f}_{1}}-{{f}_{0}}\] and \[DE={{f}_{1}}-{{f}_{2}}.\]
\[\Rightarrow \dfrac{AB}{CD}=\dfrac{BE}{DE}=\dfrac{{{f}_{1}}-{{f}_{0}}}{{{f}_{1}}-{{f}_{2}}}\]
\[\Rightarrow \dfrac{AB}{CD}=\dfrac{{{f}_{1}}-{{f}_{0}}}{{{f}_{1}}-{{f}_{2}}}\]
Again we have \[\Delta BEF\sim \Delta BDC\] from the figure.
\[\Rightarrow \dfrac{FE}{BC}=\dfrac{BE}{BD}\]
Clearly, \[BE={{f}_{1}}-{{f}_{0}}\] and \[BD=BE+ED\]
\[\Rightarrow BD=\left( {{f}_{1}}-{{f}_{0}} \right)+\left( {{f}_{1}}-{{f}_{2}} \right)\]
\[\Rightarrow BD={{f}_{1}}-{{f}_{0}}+{{f}_{1}}-{{f}_{2}}\]
\[\Rightarrow BD=2{{f}_{1}}-{{f}_{0}}-{{f}_{2}}\]
Therefore, we have,
\[\dfrac{FE}{BC}=\dfrac{BE}{BD}=\dfrac{{{f}_{1}}-{{f}_{0}}}{2{{f}_{1}}-{{f}_{0}}-{{f}_{2}}}\]
\[\Rightarrow \dfrac{FE}{BC}=\dfrac{{{f}_{1}}-{{f}_{0}}}{2{{f}_{1}}-{{f}_{0}}-{{f}_{2}}}\]
\[\Rightarrow FE=\dfrac{{{f}_{1}}-{{f}_{0}}}{2{{f}_{1}}-{{f}_{0}}-{{f}_{2}}}\times BC\]
We know that \[BC={{f}_{1}},\] so we can write
\[\Rightarrow FE=\left( \dfrac{{{f}_{1}}-{{f}_{0}}}{2{{f}_{1}}-{{f}_{0}}-{{f}_{2}}} \right)\times {{f}_{1}}\]
Let, FE be x.
\[\Rightarrow x=\left( \dfrac{{{f}_{1}}-{{f}_{0}}}{2{{f}_{1}}-{{f}_{0}}-{{f}_{2}}} \right)\times {{f}_{1}}\]
Therefore, the mode can be obtained by adding this value of x to \[{{I}_{0}}.\]
\[\Rightarrow \text{Mode}={{I}_{0}}+x\]
Substituting the value of x as obtained from above, we get,
\[\Rightarrow \text{Mode}={{I}_{0}}+x\]
\[\Rightarrow \text{Mode}={{I}_{0}}+\left( \dfrac{{{f}_{1}}-{{f}_{0}}}{2{{f}_{1}}-{{f}_{0}}-{{f}_{2}}} \right)\times {{f}_{1}}\]
\[\Rightarrow \text{Mode}={{I}_{0}}+\dfrac{\left( {{f}_{1}}-{{f}_{0}} \right)}{2{{f}_{1}}-{{f}_{0}}-{{f}_{2}}}\times {{f}_{1}}\]
Hence, the mode formula is determined.
\[\Rightarrow \text{Mode}={{I}_{0}}+\dfrac{\left( {{f}_{1}}-{{f}_{0}} \right)}{2{{f}_{1}}-{{f}_{0}}-{{f}_{2}}}\times {{f}_{1}}\]
Note: We have used the bar graph to determine the mode formula. So, \[{{f}_{0}}\] is considered a point after the first bar and the midpoint of the highest bar is the mode. The highest bar is in the middle. So, we have assumed x = midpoint of the largest bar and hence calculate \[{{I}_{0}}+x\] to get the mode value.
Complete step-by-step answer:
Let us first define the mode for grouped data. The mode of a list of data values is simply the most common values (or the values if any). When the data are grouped as in a histogram, we will normally talk only about the modal class (the class, or group with the greatest frequency) because we don’t know the individual values. The derivation of the mode formula is given by using the bar graph.
Let the frequency of the modal class be \[{{f}_{1}}.\] The frequency of the class first after the modal class is \[{{f}_{2}}.\] From the above figure, we see that, triangle AEB is similar to triangle DEC.
\[\Rightarrow \Delta AEB\sim \Delta DEC\]
The relative side ratio is also equal.
\[\Rightarrow \Delta AEB\sim \Delta DEC\]
\[\Rightarrow \dfrac{AB}{CD}=\dfrac{BE}{DE}\]
And BE is nothing but \[{{f}_{1}}-{{f}_{0}}\] and \[DE={{f}_{1}}-{{f}_{2}}.\]
\[\Rightarrow \dfrac{AB}{CD}=\dfrac{BE}{DE}=\dfrac{{{f}_{1}}-{{f}_{0}}}{{{f}_{1}}-{{f}_{2}}}\]
\[\Rightarrow \dfrac{AB}{CD}=\dfrac{{{f}_{1}}-{{f}_{0}}}{{{f}_{1}}-{{f}_{2}}}\]
Again we have \[\Delta BEF\sim \Delta BDC\] from the figure.
\[\Rightarrow \dfrac{FE}{BC}=\dfrac{BE}{BD}\]
Clearly, \[BE={{f}_{1}}-{{f}_{0}}\] and \[BD=BE+ED\]
\[\Rightarrow BD=\left( {{f}_{1}}-{{f}_{0}} \right)+\left( {{f}_{1}}-{{f}_{2}} \right)\]
\[\Rightarrow BD={{f}_{1}}-{{f}_{0}}+{{f}_{1}}-{{f}_{2}}\]
\[\Rightarrow BD=2{{f}_{1}}-{{f}_{0}}-{{f}_{2}}\]
Therefore, we have,
\[\dfrac{FE}{BC}=\dfrac{BE}{BD}=\dfrac{{{f}_{1}}-{{f}_{0}}}{2{{f}_{1}}-{{f}_{0}}-{{f}_{2}}}\]
\[\Rightarrow \dfrac{FE}{BC}=\dfrac{{{f}_{1}}-{{f}_{0}}}{2{{f}_{1}}-{{f}_{0}}-{{f}_{2}}}\]
\[\Rightarrow FE=\dfrac{{{f}_{1}}-{{f}_{0}}}{2{{f}_{1}}-{{f}_{0}}-{{f}_{2}}}\times BC\]
We know that \[BC={{f}_{1}},\] so we can write
\[\Rightarrow FE=\left( \dfrac{{{f}_{1}}-{{f}_{0}}}{2{{f}_{1}}-{{f}_{0}}-{{f}_{2}}} \right)\times {{f}_{1}}\]
Let, FE be x.
\[\Rightarrow x=\left( \dfrac{{{f}_{1}}-{{f}_{0}}}{2{{f}_{1}}-{{f}_{0}}-{{f}_{2}}} \right)\times {{f}_{1}}\]
Therefore, the mode can be obtained by adding this value of x to \[{{I}_{0}}.\]
\[\Rightarrow \text{Mode}={{I}_{0}}+x\]
Substituting the value of x as obtained from above, we get,
\[\Rightarrow \text{Mode}={{I}_{0}}+x\]
\[\Rightarrow \text{Mode}={{I}_{0}}+\left( \dfrac{{{f}_{1}}-{{f}_{0}}}{2{{f}_{1}}-{{f}_{0}}-{{f}_{2}}} \right)\times {{f}_{1}}\]
\[\Rightarrow \text{Mode}={{I}_{0}}+\dfrac{\left( {{f}_{1}}-{{f}_{0}} \right)}{2{{f}_{1}}-{{f}_{0}}-{{f}_{2}}}\times {{f}_{1}}\]
Hence, the mode formula is determined.
\[\Rightarrow \text{Mode}={{I}_{0}}+\dfrac{\left( {{f}_{1}}-{{f}_{0}} \right)}{2{{f}_{1}}-{{f}_{0}}-{{f}_{2}}}\times {{f}_{1}}\]
Note: We have used the bar graph to determine the mode formula. So, \[{{f}_{0}}\] is considered a point after the first bar and the midpoint of the highest bar is the mode. The highest bar is in the middle. So, we have assumed x = midpoint of the largest bar and hence calculate \[{{I}_{0}}+x\] to get the mode value.
Recently Updated Pages
Master Class 11 English: Engaging Questions & Answers for Success
Master Class 11 Social Science: Engaging Questions & Answers for Success
Master Class 11 Maths: Engaging Questions & Answers for Success
Master Class 11 Biology: Engaging Questions & Answers for Success
Master Class 11 Physics: Engaging Questions & Answers for Success
Master Class 11 Chemistry: Engaging Questions & Answers for Success
Trending doubts
One Metric ton is equal to kg A 10000 B 1000 C 100 class 11 physics CBSE
Difference Between Prokaryotic Cells and Eukaryotic Cells
1 ton equals to A 100 kg B 1000 kg C 10 kg D 10000 class 11 physics CBSE
Find the value of the expression given below sin 30circ class 11 maths CBSE
Two of the body parts which do not appear in MRI are class 11 biology CBSE
Draw a diagram of a plant cell and label at least eight class 11 biology CBSE