


Define how you can draw tangent lines.
Answer
587.7k+ views
Hint: The equation which gives a linear relationship between two variables is termed to be as tangent lines. The instantaneous slope at some$ \left( {x,y} \right)$ coordinate on some function and the change of slope is being examined is equal to the slope of the equation which give a linear relationship between two variables.
Complete step-by-step answer:
To draw tangent lines, there are three main points to keep in mind.
We have to choose a point on the curve.
At that point on the curve, we have to put the straight edge.
Make sure that the point is equidistant from the curve on both sides of the point by adjusting the angles of the straight edge.
Let us draw a rough sketch of the graph so that the tangent lines become easier to understand.
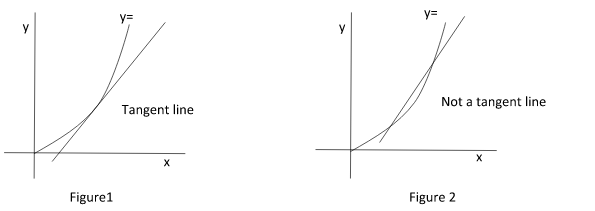
We have drawn a rough sketch of $y = {x^2}$ where$x \geqslant 0$ . In figure 1 , the line touches at one point of the curve that’s why it is a tangent line and in figure 2, the line touches two points of the curve so the straight line formed is not a tangent line.
Note: When we take a closer look to graph we can examine that on zooming it looks more and more linear as we keep zooming in and then, if we draw a straight line that traces appears to be a linear function on zooming and that straight line is the tangent line.
Complete step-by-step answer:
To draw tangent lines, there are three main points to keep in mind.
We have to choose a point on the curve.
At that point on the curve, we have to put the straight edge.
Make sure that the point is equidistant from the curve on both sides of the point by adjusting the angles of the straight edge.
Let us draw a rough sketch of the graph so that the tangent lines become easier to understand.
We have drawn a rough sketch of $y = {x^2}$ where$x \geqslant 0$ . In figure 1 , the line touches at one point of the curve that’s why it is a tangent line and in figure 2, the line touches two points of the curve so the straight line formed is not a tangent line.
Note: When we take a closer look to graph we can examine that on zooming it looks more and more linear as we keep zooming in and then, if we draw a straight line that traces appears to be a linear function on zooming and that straight line is the tangent line.
Recently Updated Pages
The given figure shows two endocrine glands marked class 11 biology NEET_UG
Match columnI with columnII and select the correct class 11 biology NEET
Match column I with column II and select the correct class 11 biology NEET_UG
Which floral family has left 9 right + 1 arrangement class 11 biology NEET_UG
Which is not a variety of sheep A Lohi B Beetal C Nellore class 11 biology NEET_UG
Match column I with column II and select the correct class 11 biology NEET_UG
Trending doubts
One Metric ton is equal to kg A 10000 B 1000 C 100 class 11 physics CBSE
Draw a diagram of a plant cell and label at least eight class 11 biology CBSE
Difference Between Prokaryotic Cells and Eukaryotic Cells
Draw a well labelled diagram of reflex arc and explain class 11 biology CBSE
Two of the body parts which do not appear in MRI are class 11 biology CBSE
1 ton equals to A 100 kg B 1000 kg C 10 kg D 10000 class 11 physics CBSE