


Copy and complete the table of values for each equation. Hence, draw the respective graphs.
$\begin{align}
& \left( i \right)y=x+5 \\
& x=0,4,7 \\
& y=? \\
\end{align}$
$\begin{align}
& \left( ii \right)y=2x \\
& x=1,3,6 \\
& y=? \\
\end{align}$
$\begin{align}
& \left( iii \right)y=2x-3 \\
& x=0,3,4,5 \\
& y=? \\
\end{align}$
$\begin{align}
& \left( iv \right)y=x-5 \\
& x=5,8,9,11 \\
& y=? \\
\end{align}$
Answer
625.2k+ views
Hint: In this question, we have to put values of $x$ in the given equation and get values of $y$. Then make a table of $x$ and $y$. Now that we have both the x and y coordinates of points, we can easily plot these on a graph. Finally, we will end up with straight lines, label all the points.
Complete step by step answer:
Now, let us get started.
(i) $y=x+5$
Here, we have been given the values of $x$ as $0,4$ and $7$. So, we will be finding corresponding values of $y$ for the same.
So, we will first put $x=0$ in the given equation and get –
$\begin{align}
& y=x+5 \\
& \Rightarrow y=0+5 \\
& \Rightarrow y=5 \\
\end{align}$
So, we have got the point as $x=0,y=5$.
Put $x=4$, we get –
$\begin{align}
& y=x+5 \\
& \Rightarrow y=4+5 \\
& \Rightarrow y=9 \\
\end{align}$
$\therefore $ We have got the point as $x=4,y=9$.
Put $x=7$, we get –
$\begin{align}
& y=x+5 \\
& \Rightarrow y=7+5 \\
& \Rightarrow y=12 \\
\end{align}$
$\therefore $ We have got the point as $x=7,y=12$.
Now, we will make a table of values for equation \[y=x+5\].
Now, we will plot the values in graph and join all points.
So, $y=x+5$ represents the curve of a straight line.
Now,
(ii) $y=2x$
Here, we have been given the values of $x$ as $1,3$and $6$. So, we will be finding corresponding values of $y$ for the same.
So, we will first put $x=1$ in the given equation and get –
\[\begin{align}
& y=2x \\
& \Rightarrow y=2\times 1 \\
& \Rightarrow y=2 \\
\end{align}\]
So, we have got the point as $x=1,y=2$.
Put $x=3$, we get –
\[\begin{align}
& y=2x \\
& \Rightarrow y=2\times 3 \\
& \Rightarrow y=6 \\
\end{align}\]
$\therefore $ We have got the point as $x=3,y=6$.
Put $x=6$, we get –
\[\begin{align}
& y=2x \\
& \Rightarrow y=2\times 6 \\
& \Rightarrow y=12 \\
\end{align}\]
$\therefore $ We have got the point as $x=6,y=12$.
Now, we will make a table of values for equation \[y=2x\].
Now, we will plot the values in graph and join all points.
So, $y=2x$ represents the curve of a straight line.
Now,
(iii) $y=2x-3$
Here, we have been given the values of $x$ as $0,3,4$and $5$. So, we will be finding corresponding values of $y$ for the same.
So, we will first put $x=0$ in the given equation and get –
$\begin{align}
& y=2x-3 \\
& \Rightarrow y=\left( 2\times 0 \right)-3 \\
& \Rightarrow y=-3 \\
\end{align}$
So, we have got the point as $x=0,y=-3$.
Put $x=3$, we get –
$\begin{align}
& y=2x-3 \\
& \Rightarrow y=\left( 2\times 3 \right)-3 \\
& \Rightarrow y=6-3 \\
& \Rightarrow y=3 \\
\end{align}$
$\therefore $ We have got the point as $x=3,y=3$.
Put $x=4$, we get –
$\begin{align}
& y=2x-3 \\
& \Rightarrow y=\left( 2\times 4 \right)-3 \\
& \Rightarrow y=8-3 \\
& \Rightarrow y=5 \\
\end{align}$
So, we have got the point as $x=4,y=5$.
Put $x=5$, we get –
$\begin{align}
& y=2x-3 \\
& \Rightarrow y=\left( 2\times 5 \right)-3 \\
& \Rightarrow y=10-3 \\
& \Rightarrow y=7 \\
\end{align}$
$\therefore $ We have got the point as $x=5,y=7$.
Now, we will make a table of values for equation \[y=2x-3\].
Now, we will plot the values in graph and join all points.
So, equation $y=2x-3$ represents the curve of a straight line.
And,
(iv) $y=x-5$
Here, we have been given the values of $x$ as $5,8,9$and $11$. So, we will be finding corresponding values of $y$ for the same.
So, we will first put $x=5$ in the given equation and get –
$\begin{align}
& y=x-5 \\
& \Rightarrow y=5-5 \\
& \Rightarrow y=0 \\
\end{align}$
So, we have got the point as $x=5,y=0$.
Put $x=8$, we get –
$\begin{align}
& y=x-5 \\
& \Rightarrow y=8-5 \\
& \Rightarrow y=3 \\
\end{align}$
$\therefore $ We have got the point as $x=8,y=3$.
Put $x=9$, we get –
$\begin{align}
& y=x-5 \\
& \Rightarrow y=9-5 \\
& \Rightarrow y=4 \\
\end{align}$
So, we have got the point as $x=9,y=4$.
Put $x=11$, we get –
$\begin{align}
& y=x-5 \\
& \Rightarrow y=11-5 \\
& \Rightarrow y=6 \\
\end{align}$
$\therefore $ We have got the point as $x=11,y=6$.
Now, we will make a table of values for equation \[y=x-5\].
Now, we will plot the values in graph and join all points.
So, equation $y=x-5$ also represents the curve of a straight line.
Note:
In this type of question, we assume the value of $x$ and get the value of $y$ by an equation, and by joining all points on a graph, we get the curve of the equation. According to the above four examples – $y=ax+b$, where $a,b$ are constants, represents a straight line. Since these are equations of a line, we must get a straight lie after plotting the points and connecting them. If we are not getting a straight line, we must always recheck the calculated coordinates for each value of x and reconfirm.
Complete step by step answer:
Now, let us get started.
(i) $y=x+5$
Here, we have been given the values of $x$ as $0,4$ and $7$. So, we will be finding corresponding values of $y$ for the same.
So, we will first put $x=0$ in the given equation and get –
$\begin{align}
& y=x+5 \\
& \Rightarrow y=0+5 \\
& \Rightarrow y=5 \\
\end{align}$
So, we have got the point as $x=0,y=5$.
Put $x=4$, we get –
$\begin{align}
& y=x+5 \\
& \Rightarrow y=4+5 \\
& \Rightarrow y=9 \\
\end{align}$
$\therefore $ We have got the point as $x=4,y=9$.
Put $x=7$, we get –
$\begin{align}
& y=x+5 \\
& \Rightarrow y=7+5 \\
& \Rightarrow y=12 \\
\end{align}$
$\therefore $ We have got the point as $x=7,y=12$.
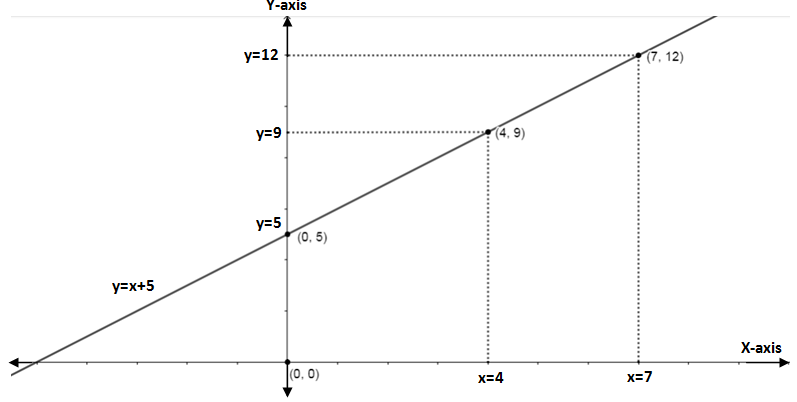
Now, we will make a table of values for equation \[y=x+5\].
| $x$ | $0$ | $4$ | $7$ |
| $y$ | $5$ | $9$ | $12$ |
Now, we will plot the values in graph and join all points.
So, $y=x+5$ represents the curve of a straight line.
Now,
(ii) $y=2x$
Here, we have been given the values of $x$ as $1,3$and $6$. So, we will be finding corresponding values of $y$ for the same.
So, we will first put $x=1$ in the given equation and get –
\[\begin{align}
& y=2x \\
& \Rightarrow y=2\times 1 \\
& \Rightarrow y=2 \\
\end{align}\]
So, we have got the point as $x=1,y=2$.
Put $x=3$, we get –
\[\begin{align}
& y=2x \\
& \Rightarrow y=2\times 3 \\
& \Rightarrow y=6 \\
\end{align}\]
$\therefore $ We have got the point as $x=3,y=6$.
Put $x=6$, we get –
\[\begin{align}
& y=2x \\
& \Rightarrow y=2\times 6 \\
& \Rightarrow y=12 \\
\end{align}\]
$\therefore $ We have got the point as $x=6,y=12$.
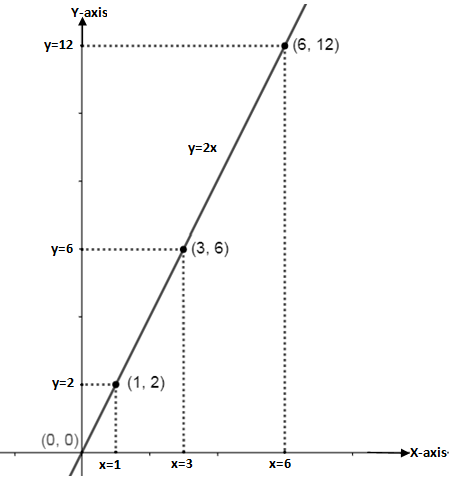
Now, we will make a table of values for equation \[y=2x\].
| $x$ | $1$ | $3$ | $6$ |
| $y$ | $2$ | $6$ | $12$ |
Now, we will plot the values in graph and join all points.
So, $y=2x$ represents the curve of a straight line.
Now,
(iii) $y=2x-3$
Here, we have been given the values of $x$ as $0,3,4$and $5$. So, we will be finding corresponding values of $y$ for the same.
So, we will first put $x=0$ in the given equation and get –
$\begin{align}
& y=2x-3 \\
& \Rightarrow y=\left( 2\times 0 \right)-3 \\
& \Rightarrow y=-3 \\
\end{align}$
So, we have got the point as $x=0,y=-3$.
Put $x=3$, we get –
$\begin{align}
& y=2x-3 \\
& \Rightarrow y=\left( 2\times 3 \right)-3 \\
& \Rightarrow y=6-3 \\
& \Rightarrow y=3 \\
\end{align}$
$\therefore $ We have got the point as $x=3,y=3$.
Put $x=4$, we get –
$\begin{align}
& y=2x-3 \\
& \Rightarrow y=\left( 2\times 4 \right)-3 \\
& \Rightarrow y=8-3 \\
& \Rightarrow y=5 \\
\end{align}$
So, we have got the point as $x=4,y=5$.
Put $x=5$, we get –
$\begin{align}
& y=2x-3 \\
& \Rightarrow y=\left( 2\times 5 \right)-3 \\
& \Rightarrow y=10-3 \\
& \Rightarrow y=7 \\
\end{align}$
$\therefore $ We have got the point as $x=5,y=7$.
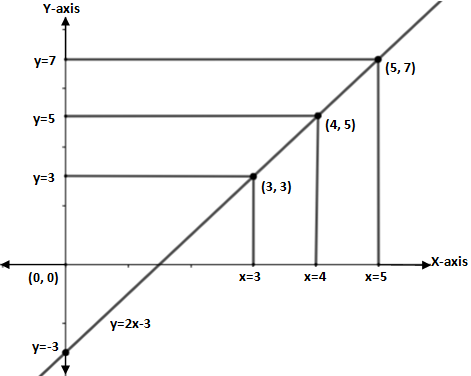
Now, we will make a table of values for equation \[y=2x-3\].
| $x$ | $0$ | $3$ | $4$ | $5$ |
| $y$ | $-3$ | $3$ | $5$ | $7$ |
Now, we will plot the values in graph and join all points.
So, equation $y=2x-3$ represents the curve of a straight line.
And,
(iv) $y=x-5$
Here, we have been given the values of $x$ as $5,8,9$and $11$. So, we will be finding corresponding values of $y$ for the same.
So, we will first put $x=5$ in the given equation and get –
$\begin{align}
& y=x-5 \\
& \Rightarrow y=5-5 \\
& \Rightarrow y=0 \\
\end{align}$
So, we have got the point as $x=5,y=0$.
Put $x=8$, we get –
$\begin{align}
& y=x-5 \\
& \Rightarrow y=8-5 \\
& \Rightarrow y=3 \\
\end{align}$
$\therefore $ We have got the point as $x=8,y=3$.
Put $x=9$, we get –
$\begin{align}
& y=x-5 \\
& \Rightarrow y=9-5 \\
& \Rightarrow y=4 \\
\end{align}$
So, we have got the point as $x=9,y=4$.
Put $x=11$, we get –
$\begin{align}
& y=x-5 \\
& \Rightarrow y=11-5 \\
& \Rightarrow y=6 \\
\end{align}$
$\therefore $ We have got the point as $x=11,y=6$.
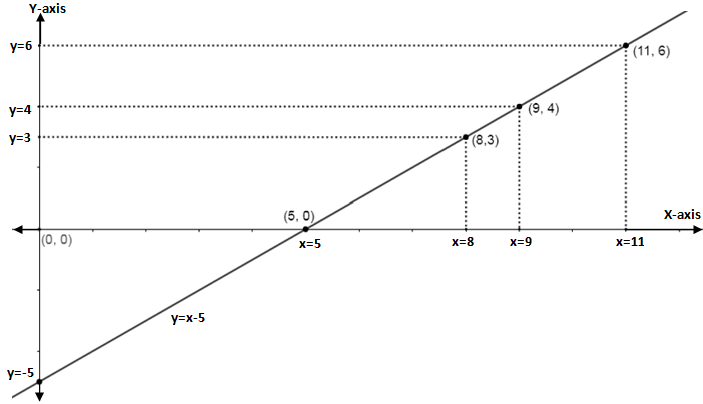
Now, we will make a table of values for equation \[y=x-5\].
| $x$ | $5$ | $8$ | $9$ | $11$ |
| $y$ | $0$ | $3$ | $4$ | $6$ |
Now, we will plot the values in graph and join all points.
So, equation $y=x-5$ also represents the curve of a straight line.
Note:
In this type of question, we assume the value of $x$ and get the value of $y$ by an equation, and by joining all points on a graph, we get the curve of the equation. According to the above four examples – $y=ax+b$, where $a,b$ are constants, represents a straight line. Since these are equations of a line, we must get a straight lie after plotting the points and connecting them. If we are not getting a straight line, we must always recheck the calculated coordinates for each value of x and reconfirm.
Recently Updated Pages
Master Class 11 English: Engaging Questions & Answers for Success
Master Class 11 Social Science: Engaging Questions & Answers for Success
Master Class 11 Maths: Engaging Questions & Answers for Success
Master Class 11 Biology: Engaging Questions & Answers for Success
Master Class 11 Physics: Engaging Questions & Answers for Success
Master Class 11 Chemistry: Engaging Questions & Answers for Success