


Construct more than ogive (a cumulative frequency graph) for the following table.
Class(Marks) Frequency \[10 - 15\] \[2\] \[15 - 20\] \[2\] \[20 - 25\] \[2\] \[25 - 30\] \[3\] \[30 - 35\] \[6\] \[35 - 40\] \[6\] \[40 - 45\] \[4\] \[45 - 50\] \[3\]
| Class(Marks) | Frequency |
| \[10 - 15\] | \[2\] |
| \[15 - 20\] | \[2\] |
| \[20 - 25\] | \[2\] |
| \[25 - 30\] | \[3\] |
| \[30 - 35\] | \[6\] |
| \[35 - 40\] | \[6\] |
| \[40 - 45\] | \[4\] |
| \[45 - 50\] | \[3\] |
Answer
539.1k+ views
Hint: Here, in the given question, we are asked to draw a more than ogive graph of the data given in the table. To solve the question, we will make the table again with the cumulative frequency (more than type) for the given data. After that we will use the table and construct the graph.
Complete step by step answer:
We will first understand the definition of ogive. The ogive can be defined as the frequency distribution graph of a series. The ogive is a graph of cumulative distribution that explains data value on the\[x\]-axis and the cumulative relative frequencies or the cumulative percent frequencies on the\[y\]-axis.
More than ogive: The frequencies of the succeeding classes are added to the frequency of a particular interval. This series is named as the More than cumulative series.
The data given is,
Now, we will make a new table with an additional column i.e. more than type cumulative frequency column.
Now, we will use this data and plot the ogive graph taking lower class limits of the intervals on\[x\]-axis and cumulative frequencies on the\[y\]-axis.
Note: The graphs of frequency distribution are the graphs that exhibit the characteristics of the discrete as well as continuous data. Also, graphs are easier to understand than the data in any other form. It makes it easier to compare the data for two or more classes simultaneously.
One thing to keep in mind here is that cumulative frequencies must be calculated as shown in the table above. Otherwise we can make a mistake and it will lead to a wrong ogive graph.
Complete step by step answer:
We will first understand the definition of ogive. The ogive can be defined as the frequency distribution graph of a series. The ogive is a graph of cumulative distribution that explains data value on the\[x\]-axis and the cumulative relative frequencies or the cumulative percent frequencies on the\[y\]-axis.
More than ogive: The frequencies of the succeeding classes are added to the frequency of a particular interval. This series is named as the More than cumulative series.
The data given is,
| Class(Marks) | Frequency |
| \[10 - 15\] | \[2\] |
| \[15 - 20\] | \[2\] |
| \[20 - 25\] | \[2\] |
| \[25 - 30\] | \[3\] |
| \[30 - 35\] | \[6\] |
| \[35 - 40\] | \[6\] |
| \[40 - 45\] | \[4\] |
| \[45 - 50\] | \[3\] |
Now, we will make a new table with an additional column i.e. more than type cumulative frequency column.
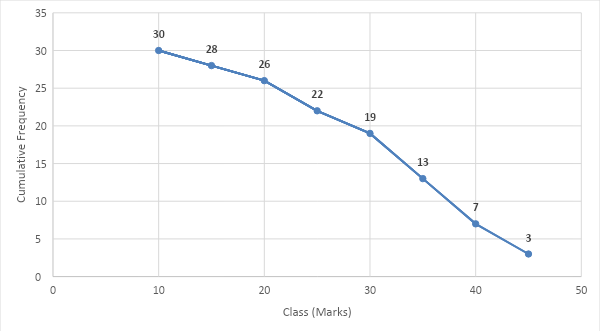
| Class(Marks) | Frequency | Cumulative Frequency (more than type) |
| \[10 - 15\] | \[2\] | \[30\] |
| \[15 - 20\] | \[2\] | \[30 - 2 = 28\] |
| \[20 - 25\] | \[2\] | \[28 - 2 = 26\] |
| \[25 - 30\] | \[3\] | \[26 - 4 = 22\] |
| \[30 - 35\] | \[6\] | \[22 - 3 = 19\] |
| \[35 - 40\] | \[6\] | \[19 - 6 = 13\] |
| \[40 - 45\] | \[4\] | \[13 - 6 = 7\] |
| \[45 - 50\] | \[3\] | \[7 - 4 = 3\] |
| Total | \[\]\[30\] |
Now, we will use this data and plot the ogive graph taking lower class limits of the intervals on\[x\]-axis and cumulative frequencies on the\[y\]-axis.
Note: The graphs of frequency distribution are the graphs that exhibit the characteristics of the discrete as well as continuous data. Also, graphs are easier to understand than the data in any other form. It makes it easier to compare the data for two or more classes simultaneously.
One thing to keep in mind here is that cumulative frequencies must be calculated as shown in the table above. Otherwise we can make a mistake and it will lead to a wrong ogive graph.
Recently Updated Pages
Master Class 10 Social Science: Engaging Questions & Answers for Success
Master Class 10 Science: Engaging Questions & Answers for Success
Master Class 10 Maths: Engaging Questions & Answers for Success
Master Class 10 General Knowledge: Engaging Questions & Answers for Success
Master Class 10 Computer Science: Engaging Questions & Answers for Success
Class 10 Question and Answer - Your Ultimate Solutions Guide
Trending doubts
What is the full form of PNG A Petrol Natural Gas B class 10 chemistry CBSE
Explain the Treaty of Vienna of 1815 class 10 social science CBSE
In cricket, how many legal balls are there in a standard over?
Why is there a time difference of about 5 hours between class 10 social science CBSE
Who Won 36 Oscar Awards? Record Holder Revealed
What is the median of the first 10 natural numbers class 10 maths CBSE