


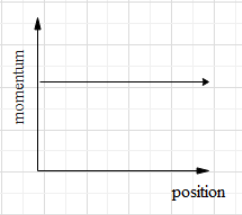
Consider the spring-mass system, with the mass submerged in water, as shown in the figure. The phase space diagram for one cycle of this system is
Answer
610.5k+ views
Hint: A phase space diagram defines the complex dynamics in a 6-dimensional space with three position coordinates and three momentum coordinates. Observe the given condition in the question and then find the change in momentum of the object with respect to the change in position. Compare it with the given diagram in the question and find the required answer.
Complete answer:
In solving some problems of statistical mechanics or dynamics, we use a six-dimensional space consisting of six position and momentum coordinates. This conventional space is called the phase space. When we draw a phase space diagram, we will consider the position in one axis and the momentum on the other axis.
In a phase space diagram, we show the change of momentum of the object with respect to the change in position.
In the question, we are given a spring mass system where the mass is submerged in water.
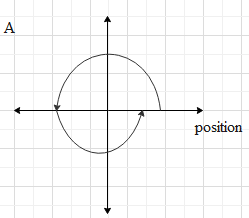
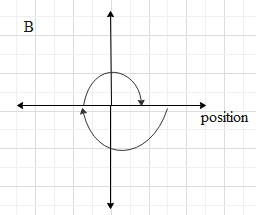
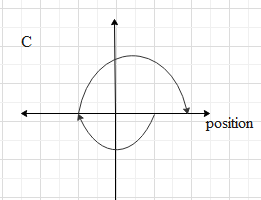
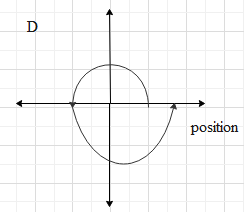
Again, from the diagram, we know that the initial position of the mass is positive. This means that the mass starts moving from above the mean position of the mass in the mass-spring system.
Now, as the mass moves towards the mean position, the velocity of the mass increases and velocity will be maximum at the mean position or we can say that the velocity of the object will be, maximum at position zero. So, we can say that the momentum of the mass increases as the mass moves towards the mean position and the momentum will be maximum at the mean position. Here, the change in momentum of the object will be in the negative direction as the object is moving downwards. Again, the mass will move downwards after the mean position, and at the maximum displacement the momentum will be zero and the maximum displacement will be slightly less than the first maximum displacement. After that, the mass will again move upward and at the mean position the mass will have maximum momentum. This change will be in the positive direction.
If we observe the given phase-diagrams in the question, we can say that the diagram in option B will represent the above case.
So, the correct option is (B).
Note:
The phase space diagrams are very useful tools to analyse the different dynamical problems. Phase space diagrams are specially useful in studying changes in the motion of the object as the initial position and the momentum of the object changes with time.
Complete answer:
In solving some problems of statistical mechanics or dynamics, we use a six-dimensional space consisting of six position and momentum coordinates. This conventional space is called the phase space. When we draw a phase space diagram, we will consider the position in one axis and the momentum on the other axis.
In a phase space diagram, we show the change of momentum of the object with respect to the change in position.
In the question, we are given a spring mass system where the mass is submerged in water.
Again, from the diagram, we know that the initial position of the mass is positive. This means that the mass starts moving from above the mean position of the mass in the mass-spring system.
Now, as the mass moves towards the mean position, the velocity of the mass increases and velocity will be maximum at the mean position or we can say that the velocity of the object will be, maximum at position zero. So, we can say that the momentum of the mass increases as the mass moves towards the mean position and the momentum will be maximum at the mean position. Here, the change in momentum of the object will be in the negative direction as the object is moving downwards. Again, the mass will move downwards after the mean position, and at the maximum displacement the momentum will be zero and the maximum displacement will be slightly less than the first maximum displacement. After that, the mass will again move upward and at the mean position the mass will have maximum momentum. This change will be in the positive direction.
If we observe the given phase-diagrams in the question, we can say that the diagram in option B will represent the above case.
So, the correct option is (B).
Note:
The phase space diagrams are very useful tools to analyse the different dynamical problems. Phase space diagrams are specially useful in studying changes in the motion of the object as the initial position and the momentum of the object changes with time.
Recently Updated Pages
Master Class 11 Social Science: Engaging Questions & Answers for Success
Master Class 11 Chemistry: Engaging Questions & Answers for Success
Master Class 12 Business Studies: Engaging Questions & Answers for Success
Master Class 12 Chemistry: Engaging Questions & Answers for Success
Master Class 12 Biology: Engaging Questions & Answers for Success
Class 12 Question and Answer - Your Ultimate Solutions Guide
Trending doubts
One Metric ton is equal to kg A 10000 B 1000 C 100 class 11 physics CBSE
Difference Between Prokaryotic Cells and Eukaryotic Cells
How many of the following diseases can be studied with class 11 biology CBSE
Two of the body parts which do not appear in MRI are class 11 biology CBSE
Which of the following enzymes is used for carboxylation class 11 biology CBSE
Explain zero factorial class 11 maths CBSE