


Can your lower quartile be the same as your median in a box and whisker plot? How?
Answer
562.5k+ views
Hint: To solve this question first we need to know about the box and whisker plot.
Complete step by step solution:
We know that a box plot is a graph that offers us an idea about how the values in the data should be spread. Box plot extends its lines from the boxes generally called as whiskers. Whiskers are used to indicate variability outside the upper and the lower quartile.
A box plot has a five number summary of a set of data that includes the minimum score, first quartile (lower), median, third quartile (upper) and maximum score. The lower quartile falls below 25 percent of scores and upper quartile falls below 75 percent of the scores.
Let us take an example of a dataset.
We have a sorted data as $\left\{ 1,2,3,4,5,6,7 \right\}$
Now, the median ${{Q}_{2}}$ of the above dataset is ${{Q}_{2}}=4$
So we get the lower quartile of the dataset as ${{Q}_{1}}=\left\{ 1,2,3 \right\}$
Now, the third quartile or upper quartile of the dataset is ${{Q}_{3}}=\left\{ 5,6,7 \right\}$
Now, the five numbers summary of a set of data is
Minimum score = 1
First quartile (lower) ${{Q}_{1}}=\left\{ 1,2,3 \right\}$
Median ${{Q}_{2}}=4$
Third quartile (upper) ${{Q}_{3}}=\left\{ 5,6,7 \right\}$
Maximum score = 7
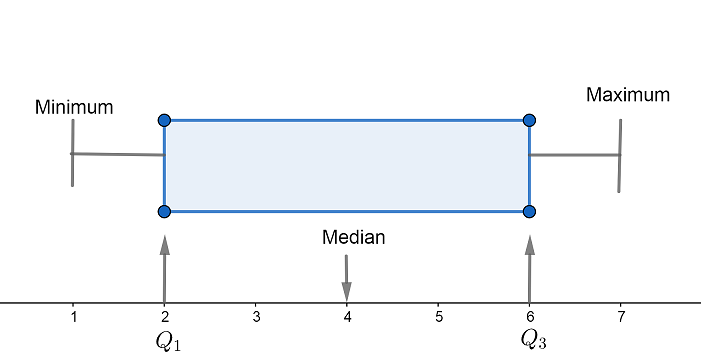
In this case we didn’t get the lower quartile the same as the median.
If we take the dataset as $\left\{ 1,1,1,3,4 \right\}$
Then we will get the five numbers summary of a set of data as
Minimum score = 1
First quartile (lower) ${{Q}_{1}}=\left\{ 1,1 \right\}$
Median ${{Q}_{2}}=1$
Third quartile (upper) ${{Q}_{3}}=\left\{ 3,4 \right\}$
Maximum score = 4
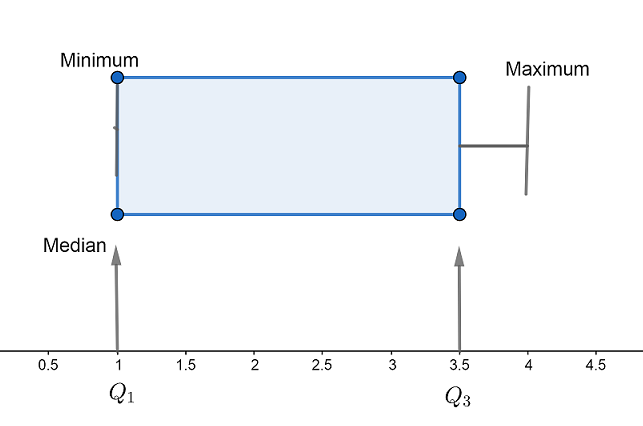
In this case we get the lower quartile same as the median in a box and whisker plot.
Note:
The point to be noted is that the lower quartile is the median of the lower half of the dataset. The whiskers go from each quartile to the minimum or maximum. A vertical line goes through the box at the median.
Complete step by step solution:
We know that a box plot is a graph that offers us an idea about how the values in the data should be spread. Box plot extends its lines from the boxes generally called as whiskers. Whiskers are used to indicate variability outside the upper and the lower quartile.
A box plot has a five number summary of a set of data that includes the minimum score, first quartile (lower), median, third quartile (upper) and maximum score. The lower quartile falls below 25 percent of scores and upper quartile falls below 75 percent of the scores.
Let us take an example of a dataset.
We have a sorted data as $\left\{ 1,2,3,4,5,6,7 \right\}$
Now, the median ${{Q}_{2}}$ of the above dataset is ${{Q}_{2}}=4$
So we get the lower quartile of the dataset as ${{Q}_{1}}=\left\{ 1,2,3 \right\}$
Now, the third quartile or upper quartile of the dataset is ${{Q}_{3}}=\left\{ 5,6,7 \right\}$
Now, the five numbers summary of a set of data is
Minimum score = 1
First quartile (lower) ${{Q}_{1}}=\left\{ 1,2,3 \right\}$
Median ${{Q}_{2}}=4$
Third quartile (upper) ${{Q}_{3}}=\left\{ 5,6,7 \right\}$
Maximum score = 7
In this case we didn’t get the lower quartile the same as the median.
If we take the dataset as $\left\{ 1,1,1,3,4 \right\}$
Then we will get the five numbers summary of a set of data as
Minimum score = 1
First quartile (lower) ${{Q}_{1}}=\left\{ 1,1 \right\}$
Median ${{Q}_{2}}=1$
Third quartile (upper) ${{Q}_{3}}=\left\{ 3,4 \right\}$
Maximum score = 4
In this case we get the lower quartile same as the median in a box and whisker plot.
Note:
The point to be noted is that the lower quartile is the median of the lower half of the dataset. The whiskers go from each quartile to the minimum or maximum. A vertical line goes through the box at the median.
Recently Updated Pages
Master Class 10 Social Science: Engaging Questions & Answers for Success
Master Class 10 Science: Engaging Questions & Answers for Success
Master Class 10 Maths: Engaging Questions & Answers for Success
Master Class 10 General Knowledge: Engaging Questions & Answers for Success
Master Class 10 Computer Science: Engaging Questions & Answers for Success
Class 10 Question and Answer - Your Ultimate Solutions Guide
Trending doubts
What is the full form of PNG A Petrol Natural Gas B class 10 chemistry CBSE
Explain the Treaty of Vienna of 1815 class 10 social science CBSE
In cricket, how many legal balls are there in a standard over?
Why is there a time difference of about 5 hours between class 10 social science CBSE
Who Won 36 Oscar Awards? Record Holder Revealed
What is the median of the first 10 natural numbers class 10 maths CBSE