What are different types of diagrams?
Answer
577.8k+ views
Hint: There are various types of the diagrams like Bar graphs, pie chart, histogram and frequency curve all represent the data distribution.
Complete step-by-step answer:
There are different types of the diagrams or charts which are given as the bar graphs, line graphs, histograms, frequency curves.
Let us discuss what these graphs are:
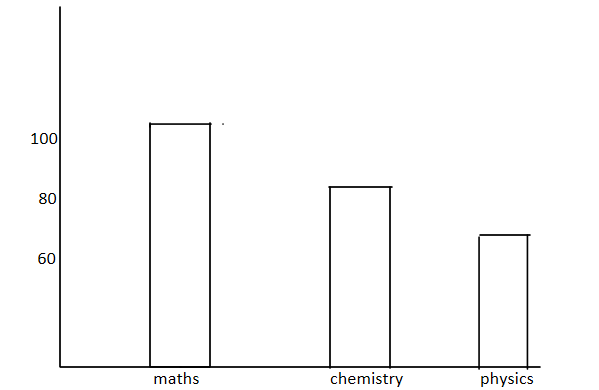
So here we need to understand the four types of graphs. 1. First of all we need to understand what a bar graph is and how it represents the data? We need to understand all the facts. So basically a bar graph is a graph which represents categorical data with the rectangular base in which the height or length represent the value they represent. The bars can be placed vertically or horizontally. Let us take an example, if we take a survey of the test of the total students. So marks of the students out of $100$ will represent the bar graph as

So it represents that boy obtaining $100$ marks in maths, almost $90$ in chemistry, $70$ in physics.so as from the view it is not in the continuous form. It represents the categorical data.
2. Pie graph: basically known as the pie chart. It is the statistical circular graph representation. Here the arc length represents the quantity it represents. It does not represent the data in the continuous form.
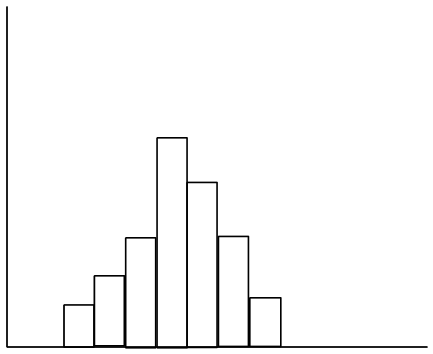
3. Histogram: A graphical display of the data using the bars of different heights. Here also the height represents the quantity it represents. Therefore it represents the data in the continuous form.

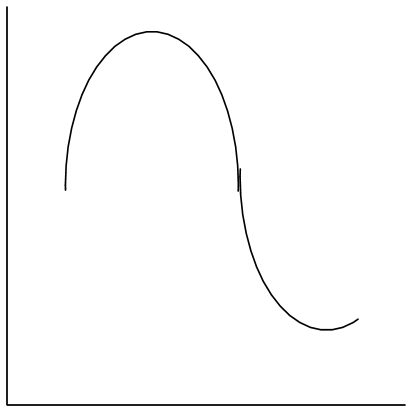
4. Frequency curve: It is the smooth curve which corresponds to the limiting case of the histogram computed for the frequency distribution of the continuous distribution of the data points.

So therefore histogram represents the data in the continuous form.
Note: The way to choose which graph is used to represent the following data type is to first determine that contains the information, comparison and then organise and relate the relation and then to choose the best chart to achieve that goal.
Complete step-by-step answer:
There are different types of the diagrams or charts which are given as the bar graphs, line graphs, histograms, frequency curves.
Let us discuss what these graphs are:
So here we need to understand the four types of graphs. 1. First of all we need to understand what a bar graph is and how it represents the data? We need to understand all the facts. So basically a bar graph is a graph which represents categorical data with the rectangular base in which the height or length represent the value they represent. The bars can be placed vertically or horizontally. Let us take an example, if we take a survey of the test of the total students. So marks of the students out of $100$ will represent the bar graph as

So it represents that boy obtaining $100$ marks in maths, almost $90$ in chemistry, $70$ in physics.so as from the view it is not in the continuous form. It represents the categorical data.
2. Pie graph: basically known as the pie chart. It is the statistical circular graph representation. Here the arc length represents the quantity it represents. It does not represent the data in the continuous form.
3. Histogram: A graphical display of the data using the bars of different heights. Here also the height represents the quantity it represents. Therefore it represents the data in the continuous form.

4. Frequency curve: It is the smooth curve which corresponds to the limiting case of the histogram computed for the frequency distribution of the continuous distribution of the data points.

So therefore histogram represents the data in the continuous form.
Note: The way to choose which graph is used to represent the following data type is to first determine that contains the information, comparison and then organise and relate the relation and then to choose the best chart to achieve that goal.
Recently Updated Pages
Master Class 10 Computer Science: Engaging Questions & Answers for Success

Master Class 10 General Knowledge: Engaging Questions & Answers for Success

Master Class 10 English: Engaging Questions & Answers for Success

Master Class 10 Social Science: Engaging Questions & Answers for Success

Master Class 10 Maths: Engaging Questions & Answers for Success

Master Class 10 Science: Engaging Questions & Answers for Success

Trending doubts
What is the median of the first 10 natural numbers class 10 maths CBSE

Which women's tennis player has 24 Grand Slam singles titles?

Who is the Brand Ambassador of Incredible India?

Why is there a time difference of about 5 hours between class 10 social science CBSE

Write a letter to the principal requesting him to grant class 10 english CBSE

A moving boat is observed from the top of a 150 m high class 10 maths CBSE


