


Analyze the graphs given below.
(a). Which graph indicates uniform velocity?
(b). Which graph indicates non uniform acceleration?
(c) .Which graph indicates the motion of freely falling stone?
Answer
559.5k+ views
Hint : We have been given velocity and time for all four cases, and we have to find out the constant velocity graph, non-uniform acceleration graph and free falling graph. Keep in mind that the slope of the velocity-time graph gives us acceleration and that acceleration is a function of time.
Complete step-by-step solution:
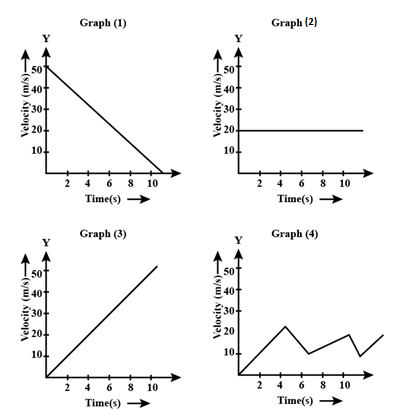
Let us look at Graph (2). The velocity \[V\] remains the same even with time \[T\]increasing, which indicates that Graph (2) has constant velocity.
Coming to Graph (3), here let us consider three cases.
When \[{v_1}\]= 10 \[\dfrac{m}{{\sec }}\]and \[{t_1}\]= 2 \[\sec\]
When \[{v_2}\]= 30 \[\dfrac{m}{{\sec }}\] and \[{t_2}\]= 6 \[\sec\]
When \[{v_3}\]= 50 \[\dfrac{m}{{\sec }}\] and \[{t_3}\]= 10 \[\sec\]
Keeping value of \[u\]= 0 as object starts from rest
Using values of 1. To find out acceleration \[{a_1}\]
\[{a_1}\] = \[\dfrac{{{v_1}}}{{{t_1}}}\]
= \[\dfrac{{10}}{2}\] \[\dfrac{m}{{{{\mathop{\rm s}\nolimits} ^2}}}\]
\[{a_1}\]= 5 \[\dfrac{m}{{{{\mathop{\rm s}\nolimits} ^2}}}\] …… (1)
Using values of 2. To find out acceleration \[{a_2}\]
\[{a_2}\] = \[\dfrac{{{v_2}}}{{{t_2}}}\]
= \[\dfrac{{30}}{6}\] \[\dfrac{m}{{{{\mathop{\rm s}\nolimits} ^2}}}\]
\[{a_2}\] = 5 \[\dfrac{m}{{{{\mathop{\rm s}\nolimits} ^2}}}\] ……(2)
Using values of 3. To find out acceleration \[{a_3}\]
\[{a_3}\] = \[\dfrac{{{v_3}}}{{{t_3}}}\]
= \[\dfrac{{50}}{{10}}\]\[\dfrac{m}{{{{\mathop{\rm s}\nolimits} ^2}}}\]
\[{a_3}\] = 5 \[\dfrac{m}{{{{\mathop{\rm s}\nolimits} ^2}}}\] ……(3)
From equation (1), (2) and (3) we get to the result that
\[{a_1}\]= \[{a_2}\] = \[{a_3}\]
Which means this graph shows constant acceleration, which happens during free fall motion.
So , Graph (3) indicates the motion of freely falling stone.
In Graph (4), we can see that the velocities and time at any given point is not constant, because the slope is changing at every point of time. This indicates that the slope isn’t constant, and hence the acceleration is changing at every point of time. This indicates that this graph shows us non-uniform acceleration.
Graph (1) indicates that the object in motion is in uniform – deceleration, because the velocity is decreasing at a constant rate at a constant given time.
So to conclude, we can say that;
Graph (2) gives us graph of constant velocity
Graph (3) gives us motion of a free falling object
Graph (4) gives us a graph of non-uniform acceleration.
Note: In Velocity- time graph, the slope gives us the information needed to find acceleration, which can be found with the equation \[v = u + at\]. Keep in mind that acceleration is a function of time, and the slope of the graph varies with the same.
Complete step-by-step solution:
Let us look at Graph (2). The velocity \[V\] remains the same even with time \[T\]increasing, which indicates that Graph (2) has constant velocity.
Coming to Graph (3), here let us consider three cases.
When \[{v_1}\]= 10 \[\dfrac{m}{{\sec }}\]and \[{t_1}\]= 2 \[\sec\]
When \[{v_2}\]= 30 \[\dfrac{m}{{\sec }}\] and \[{t_2}\]= 6 \[\sec\]
When \[{v_3}\]= 50 \[\dfrac{m}{{\sec }}\] and \[{t_3}\]= 10 \[\sec\]
Keeping value of \[u\]= 0 as object starts from rest
Using values of 1. To find out acceleration \[{a_1}\]
\[{a_1}\] = \[\dfrac{{{v_1}}}{{{t_1}}}\]
= \[\dfrac{{10}}{2}\] \[\dfrac{m}{{{{\mathop{\rm s}\nolimits} ^2}}}\]
\[{a_1}\]= 5 \[\dfrac{m}{{{{\mathop{\rm s}\nolimits} ^2}}}\] …… (1)
Using values of 2. To find out acceleration \[{a_2}\]
\[{a_2}\] = \[\dfrac{{{v_2}}}{{{t_2}}}\]
= \[\dfrac{{30}}{6}\] \[\dfrac{m}{{{{\mathop{\rm s}\nolimits} ^2}}}\]
\[{a_2}\] = 5 \[\dfrac{m}{{{{\mathop{\rm s}\nolimits} ^2}}}\] ……(2)
Using values of 3. To find out acceleration \[{a_3}\]
\[{a_3}\] = \[\dfrac{{{v_3}}}{{{t_3}}}\]
= \[\dfrac{{50}}{{10}}\]\[\dfrac{m}{{{{\mathop{\rm s}\nolimits} ^2}}}\]
\[{a_3}\] = 5 \[\dfrac{m}{{{{\mathop{\rm s}\nolimits} ^2}}}\] ……(3)
From equation (1), (2) and (3) we get to the result that
\[{a_1}\]= \[{a_2}\] = \[{a_3}\]
Which means this graph shows constant acceleration, which happens during free fall motion.
So , Graph (3) indicates the motion of freely falling stone.
In Graph (4), we can see that the velocities and time at any given point is not constant, because the slope is changing at every point of time. This indicates that the slope isn’t constant, and hence the acceleration is changing at every point of time. This indicates that this graph shows us non-uniform acceleration.
Graph (1) indicates that the object in motion is in uniform – deceleration, because the velocity is decreasing at a constant rate at a constant given time.
So to conclude, we can say that;
Graph (2) gives us graph of constant velocity
Graph (3) gives us motion of a free falling object
Graph (4) gives us a graph of non-uniform acceleration.
Note: In Velocity- time graph, the slope gives us the information needed to find acceleration, which can be found with the equation \[v = u + at\]. Keep in mind that acceleration is a function of time, and the slope of the graph varies with the same.
Recently Updated Pages
The given figure shows two endocrine glands marked class 11 biology NEET_UG
Match columnI with columnII and select the correct class 11 biology NEET
Match column I with column II and select the correct class 11 biology NEET_UG
Which floral family has left 9 right + 1 arrangement class 11 biology NEET_UG
Which is not a variety of sheep A Lohi B Beetal C Nellore class 11 biology NEET_UG
Match column I with column II and select the correct class 11 biology NEET_UG
Trending doubts
Difference Between Prokaryotic Cells and Eukaryotic Cells
One Metric ton is equal to kg A 10000 B 1000 C 100 class 11 physics CBSE
Two of the body parts which do not appear in MRI are class 11 biology CBSE
10 examples of friction in our daily life
Draw a diagram of nephron and explain its structur class 11 biology CBSE
Draw a diagram of a plant cell and label at least eight class 11 biology CBSE