


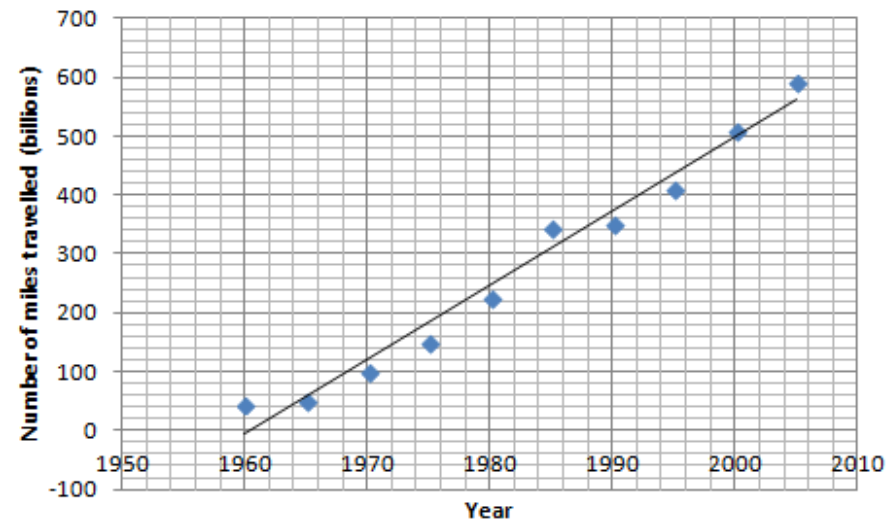
According to the line of best fit in the scatter plot below, which of the following best approximates the year in which the number of miles traveled by air passengers in country X was estimated to be 550 billion?
(a) 1997
(b) 2000
(c) 2003
(d) 2008
Answer
588.9k+ views
Hint: We have given a straight line plot in which the number of miles traveled (in billions) is plotted against different years. And we are asked to read the plot and after that, we have to find the approximate year in which 550 billion miles are traveled by passengers.
Complete step-by-step solution:
The line of best fit from the scatter plot for the number of miles traveled by air passengers against the year and we are shown that plot in the below:
Now, we have to read this plot and have to find the approximate year in which the number of miles traveled by air passengers is 550 billion. For that, first of all, we are going to locate 550 on the vertical axis of the plot then we will come to our best fit line and mark the point on that best fit line which has its vertical point corresponding to 550 then mark that point and drop a perpendicular on the horizontal axis and then see where that perpendicular is intersecting the x-axis.
In the below diagram, we have shown the perpendicular which we drop on the horizontal axis corresponding to 550 on the vertical axis.
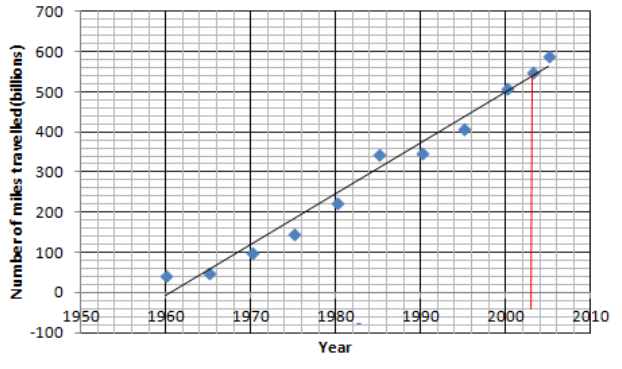
From the above figure, you can clearly see that the year in which 550 billion miles were traveled is 2003 (approx.). Hence, the correct option is (c).
Note: The possible source of error that could happen in solving this problem is that you might have wrongly located 550 on the best fit line which will lead to the wrong intersection of perpendicular on the horizontal axis. And, hence will lead to the wrong location of the year. So, you should be very careful in locating the points on the plot.
Complete step-by-step solution:
The line of best fit from the scatter plot for the number of miles traveled by air passengers against the year and we are shown that plot in the below:
Now, we have to read this plot and have to find the approximate year in which the number of miles traveled by air passengers is 550 billion. For that, first of all, we are going to locate 550 on the vertical axis of the plot then we will come to our best fit line and mark the point on that best fit line which has its vertical point corresponding to 550 then mark that point and drop a perpendicular on the horizontal axis and then see where that perpendicular is intersecting the x-axis.
In the below diagram, we have shown the perpendicular which we drop on the horizontal axis corresponding to 550 on the vertical axis.
From the above figure, you can clearly see that the year in which 550 billion miles were traveled is 2003 (approx.). Hence, the correct option is (c).
Note: The possible source of error that could happen in solving this problem is that you might have wrongly located 550 on the best fit line which will lead to the wrong intersection of perpendicular on the horizontal axis. And, hence will lead to the wrong location of the year. So, you should be very careful in locating the points on the plot.
Recently Updated Pages
Basicity of sulphurous acid and sulphuric acid are
Master Class 10 English: Engaging Questions & Answers for Success
Master Class 10 Social Science: Engaging Questions & Answers for Success
Master Class 10 Computer Science: Engaging Questions & Answers for Success
Class 10 Question and Answer - Your Ultimate Solutions Guide
Master Class 10 General Knowledge: Engaging Questions & Answers for Success
Trending doubts
Who is known as the "Little Master" in Indian cricket history?
Explain the Treaty of Vienna of 1815 class 10 social science CBSE
A boat goes 24 km upstream and 28 km downstream in class 10 maths CBSE
Which are the three major ports of Tamil Nadu A Chennai class 10 social science CBSE
The highest dam in India is A Bhakra dam B Tehri dam class 10 social science CBSE
Describe the process of Unification of Italy class 10 social science CBSE