


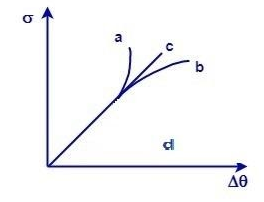
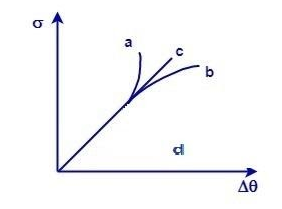
A uniform metal rod is fixed at one end to a rigid support and its temperature is gradually increased. If a plot be made of the stress $ \left( \sigma \right) $ versus increment in temperature $ \Delta \theta $ , which curve best represents it?
(A) a
(B) b
(C) c
(D) d
Answer
571.8k+ views
Hint: Use the formula of length expansion due to application of temperature on a metal rod i.e.
$\Rightarrow l'=l\left( 1+\alpha \Delta \theta \right) $
Where, $ l' $ is the increased length of metal rod,
$ l $ is the original length of the metal rod,
$ \alpha $ is the linear coefficient of expansion,
$ \Delta \theta $ is the change in temperature.
Complete step by step solution
Length expansion in the given uniform metallic rod is given by:
$\Rightarrow l'=l\left( 1+\alpha \Delta \theta \right) $
$ \begin{align}
&\Rightarrow l'=l+l\alpha \Delta \theta \\
&\Rightarrow l'-l=l\alpha \Delta \theta \\
&\Rightarrow \dfrac{l'-l}{l}=\alpha \Delta \theta \\
&\Rightarrow \dfrac{\Delta l}{l}=\alpha \Delta \theta \\
\end{align} $
But $ \dfrac{\Delta l}{l}=Strain $
So $ Strain=\alpha \Delta \theta $
Also we know that the elasticity of a body is given by:
$\Rightarrow Y=\dfrac{Stress\left( \sigma \right)}{Strain} $
$ \begin{align}
&\Rightarrow \sigma =Y\times Strain \\
&\Rightarrow \sigma =Y\alpha \Delta \theta \text{ }.....................\text{ (1)} \\
\end{align} $
We can clearly see in the equation (1) that stress is directly proportional to the change in temperature.
Hence the graph plotted between them will be linear in shape.
From the given options curve c i.e. option (C) is the required graph.
Note
Stress is the magnitude of force that causes the deformation in the body and is equal to the pressure applied. With the increase in temperature, the length of the rod increases and hence, the force of deformation i.e. stress is also increased on the body.
$\Rightarrow l'=l\left( 1+\alpha \Delta \theta \right) $
Where, $ l' $ is the increased length of metal rod,
$ l $ is the original length of the metal rod,
$ \alpha $ is the linear coefficient of expansion,
$ \Delta \theta $ is the change in temperature.
Complete step by step solution
Length expansion in the given uniform metallic rod is given by:
$\Rightarrow l'=l\left( 1+\alpha \Delta \theta \right) $
$ \begin{align}
&\Rightarrow l'=l+l\alpha \Delta \theta \\
&\Rightarrow l'-l=l\alpha \Delta \theta \\
&\Rightarrow \dfrac{l'-l}{l}=\alpha \Delta \theta \\
&\Rightarrow \dfrac{\Delta l}{l}=\alpha \Delta \theta \\
\end{align} $
But $ \dfrac{\Delta l}{l}=Strain $
So $ Strain=\alpha \Delta \theta $
Also we know that the elasticity of a body is given by:
$\Rightarrow Y=\dfrac{Stress\left( \sigma \right)}{Strain} $
$ \begin{align}
&\Rightarrow \sigma =Y\times Strain \\
&\Rightarrow \sigma =Y\alpha \Delta \theta \text{ }.....................\text{ (1)} \\
\end{align} $
We can clearly see in the equation (1) that stress is directly proportional to the change in temperature.
Hence the graph plotted between them will be linear in shape.
From the given options curve c i.e. option (C) is the required graph.
Note
Stress is the magnitude of force that causes the deformation in the body and is equal to the pressure applied. With the increase in temperature, the length of the rod increases and hence, the force of deformation i.e. stress is also increased on the body.
Recently Updated Pages
Master Class 11 Business Studies: Engaging Questions & Answers for Success
Master Class 11 Computer Science: Engaging Questions & Answers for Success
Master Class 11 Economics: Engaging Questions & Answers for Success
Master Class 11 Social Science: Engaging Questions & Answers for Success
Master Class 11 English: Engaging Questions & Answers for Success
Master Class 11 Chemistry: Engaging Questions & Answers for Success
Trending doubts
Draw a diagram of nephron and explain its structur class 11 biology CBSE
Explain zero factorial class 11 maths CBSE
Chemical formula of Bleaching powder is A Ca2OCl2 B class 11 chemistry CBSE
Name the part of the brain responsible for the precision class 11 biology CBSE
The growth of tendril in pea plants is due to AEffect class 11 biology CBSE
One Metric ton is equal to kg A 10000 B 1000 C 100 class 11 physics CBSE