


A _______ graph displays data that changes continuously over periods of time.
Answer
551.7k+ views
Hint: It comprises two axes two represent the changes over time. The axes are x-axis and y-axis. In this graph we connect individual data points that typically display quantitative values over a specified time interval.
Complete answer:
Line graphs show how the value of something changes over a period of time, or compare how several things change over time relative to each other. We plot line graphs using several points connected by a straight line. Line graphs are commonly called line charts.Line graph comprises two axes x-axis and y-axis. The horizontal axis is known as x-axis and the vertical is y-axis. The x axis is an independent axis and the y-axis is dependent, as it depends on the x-axis.Each axis represents a different data type.
There are three types of line graph:-
Simple line graph: - Only one line is plotted on the graph
Multiple line graphs: - More than one line is plotted on the same set of axes.
Compound line graph: - When information can be divided into two or more types of data.
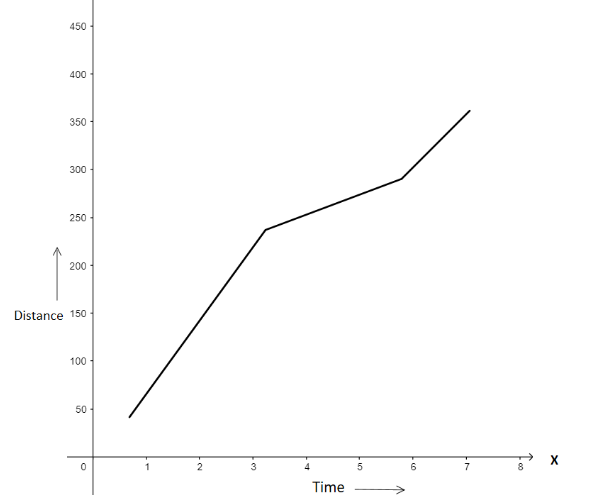
A general linear function has the form $y=mx+c$, where $y$ is the y-coordinate, m is slope of the line, $x$ is x-coordinate corresponding to y- coordinate and c is the y-intercept of the line. It is graphically denoted as (x,y). Example of line graph : Here y- axis represents distance covered(in km) and x-axis represents time interval(in hour)
Note:For a graph to be called a line graph, it must have five main characteristics.These are TITLE, SCALE, POINTS, LABELS and LINE. Line graphs are quite informative in allowing the user to visualize trends, which can greatly aid them in their analyses.
Complete answer:
Line graphs show how the value of something changes over a period of time, or compare how several things change over time relative to each other. We plot line graphs using several points connected by a straight line. Line graphs are commonly called line charts.Line graph comprises two axes x-axis and y-axis. The horizontal axis is known as x-axis and the vertical is y-axis. The x axis is an independent axis and the y-axis is dependent, as it depends on the x-axis.Each axis represents a different data type.
There are three types of line graph:-
Simple line graph: - Only one line is plotted on the graph
Multiple line graphs: - More than one line is plotted on the same set of axes.
Compound line graph: - When information can be divided into two or more types of data.
A general linear function has the form $y=mx+c$, where $y$ is the y-coordinate, m is slope of the line, $x$ is x-coordinate corresponding to y- coordinate and c is the y-intercept of the line. It is graphically denoted as (x,y). Example of line graph : Here y- axis represents distance covered(in km) and x-axis represents time interval(in hour)
Note:For a graph to be called a line graph, it must have five main characteristics.These are TITLE, SCALE, POINTS, LABELS and LINE. Line graphs are quite informative in allowing the user to visualize trends, which can greatly aid them in their analyses.
Recently Updated Pages
Master Class 11 Social Science: Engaging Questions & Answers for Success
Master Class 11 English: Engaging Questions & Answers for Success
Master Class 11 Maths: Engaging Questions & Answers for Success
Master Class 11 Chemistry: Engaging Questions & Answers for Success
Master Class 11 Biology: Engaging Questions & Answers for Success
Class 11 Question and Answer - Your Ultimate Solutions Guide
Trending doubts
One Metric ton is equal to kg A 10000 B 1000 C 100 class 11 physics CBSE
Difference Between Prokaryotic Cells and Eukaryotic Cells
Find the value of the expression given below sin 30circ class 11 maths CBSE
1 ton equals to A 100 kg B 1000 kg C 10 kg D 10000 class 11 physics CBSE
Two of the body parts which do not appear in MRI are class 11 biology CBSE
Draw a diagram of nephron and explain its structur class 11 biology CBSE