


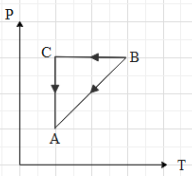
A cyclic process ABCA shown in V-T diagram is performed with a constant mass of an ideal gas. Which of the following graphs in figure represents the corresponding process on a P-V diagram
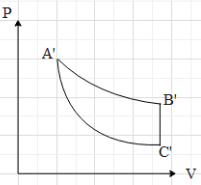
A.

B.
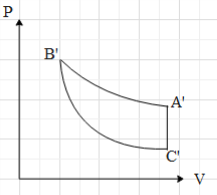
C.
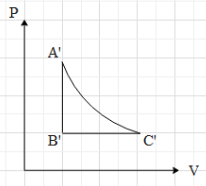
D.
Answer
571.2k+ views
Hint: To draw the P-V graph from the given cycle, we will use the ideal gas equation, which say that $PV=nRT$. Analyse what happens to the pressure and the volume of the gas when it is taken from A to B, then from B to C and finally from C to A.
Formula used:
$PV=nRT$
Here, P,V and T are the pressure, volume and temperature of the gas, n is the number of moles of the gas and R is the universal gas constant.
Complete step by step solution:
The V-T graph of a cyclic process is given and we have the P-V graph for the same cycle. Here, P,V and T are the pressure, volume and temperature of the gas. To draw the P-V graph from the given cycle, we will use the ideal gas equation, which say that $PV=nRT$ ….. (i),
where n is the number of moles of the gas and R is the universal gas constant.
It is said that the mass of the gas is constant throughout the process. This means that the number of moles (n) of the gas is constant. In the given graph, we can see that when the gas is taken from A to b, the volume of the gas is proportional to its temperature.
i.e. $V\propto T$.
$V=cT$, where c is a proportionality constant.
$\Rightarrow T=\dfrac{V}{c}$.
Substitute the value of T in (i).
$\Rightarrow PV=nR\dfrac{V}{c}$.
$\Rightarrow P=\dfrac{nR}{c}$
Since n, R and c are constants, the value of P is constant.
This means that in the P-V graph, the pressure is constant with increase in volume, when the gas is taken from A to B.Now, if the gas is taken from B to C, we can see that the volume is constant. Therefore, in P-V graph path AB is a vertical line, with increase in pressure (because the temperature is increasing). Then we can see that the gas is taken from C to A, by keeping its temperature constant. This means that $T=k$, where k is a constant.
Substitute $T=k$ in (i).
$PV=nRk$.
$\therefore PV=\text{constant}$ …. (ii).
Equation (ii) is an equation for a rectangular hyperbola in the first quadrant. Therefore, when the gas is taken from C to A, the path taken is a rectangular hyperbola in the P-V graph.Now, when we draw The P-V graph with the above data, we get that graph as:
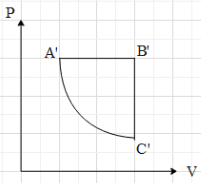
Hence, the correct option is A.
Note: When a thermodynamic process is performed on a gas by keeping its temperature constant, the process is called an isothermal process. When a thermodynamic process is performed on a gas by keeping its pressure constant, the process is called an isochoric process. When a thermodynamic process is performed on a gas by keeping its volume constant, the process is called an isobaric process.
Formula used:
$PV=nRT$
Here, P,V and T are the pressure, volume and temperature of the gas, n is the number of moles of the gas and R is the universal gas constant.
Complete step by step solution:
The V-T graph of a cyclic process is given and we have the P-V graph for the same cycle. Here, P,V and T are the pressure, volume and temperature of the gas. To draw the P-V graph from the given cycle, we will use the ideal gas equation, which say that $PV=nRT$ ….. (i),
where n is the number of moles of the gas and R is the universal gas constant.
It is said that the mass of the gas is constant throughout the process. This means that the number of moles (n) of the gas is constant. In the given graph, we can see that when the gas is taken from A to b, the volume of the gas is proportional to its temperature.
i.e. $V\propto T$.
$V=cT$, where c is a proportionality constant.
$\Rightarrow T=\dfrac{V}{c}$.
Substitute the value of T in (i).
$\Rightarrow PV=nR\dfrac{V}{c}$.
$\Rightarrow P=\dfrac{nR}{c}$
Since n, R and c are constants, the value of P is constant.
This means that in the P-V graph, the pressure is constant with increase in volume, when the gas is taken from A to B.Now, if the gas is taken from B to C, we can see that the volume is constant. Therefore, in P-V graph path AB is a vertical line, with increase in pressure (because the temperature is increasing). Then we can see that the gas is taken from C to A, by keeping its temperature constant. This means that $T=k$, where k is a constant.
Substitute $T=k$ in (i).
$PV=nRk$.
$\therefore PV=\text{constant}$ …. (ii).
Equation (ii) is an equation for a rectangular hyperbola in the first quadrant. Therefore, when the gas is taken from C to A, the path taken is a rectangular hyperbola in the P-V graph.Now, when we draw The P-V graph with the above data, we get that graph as:
Hence, the correct option is A.
Note: When a thermodynamic process is performed on a gas by keeping its temperature constant, the process is called an isothermal process. When a thermodynamic process is performed on a gas by keeping its pressure constant, the process is called an isochoric process. When a thermodynamic process is performed on a gas by keeping its volume constant, the process is called an isobaric process.
Recently Updated Pages
Master Class 11 Business Studies: Engaging Questions & Answers for Success
Master Class 11 Computer Science: Engaging Questions & Answers for Success
Master Class 11 Economics: Engaging Questions & Answers for Success
Master Class 11 Social Science: Engaging Questions & Answers for Success
Master Class 11 English: Engaging Questions & Answers for Success
Master Class 11 Chemistry: Engaging Questions & Answers for Success
Trending doubts
Draw a diagram of nephron and explain its structur class 11 biology CBSE
Explain zero factorial class 11 maths CBSE
Chemical formula of Bleaching powder is A Ca2OCl2 B class 11 chemistry CBSE
Name the part of the brain responsible for the precision class 11 biology CBSE
The growth of tendril in pea plants is due to AEffect class 11 biology CBSE
One Metric ton is equal to kg A 10000 B 1000 C 100 class 11 physics CBSE