


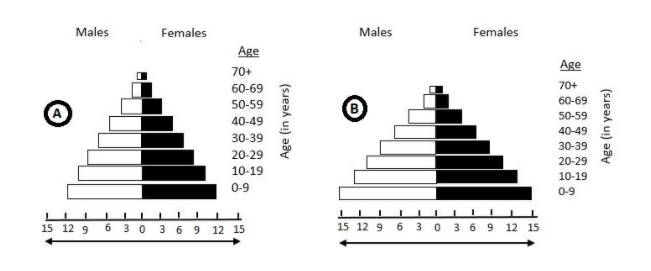
A country with a high rate of population growth took measures to reduce it. The figure shows age-sex pyramids of populations A and B twenty years apart. Select the correct interpretation about them.
A. ‘A’ is the earlier pyramid and no change has occurred in the growth rate
B. ‘A’ is more recent and shows slight reduction in the growth rate
C. ‘B’ is the earlier pyramid and shows stabilized growth rate
D. ‘B’ is more recent showing that population is very young
Answer
589.8k+ views
Hint: An age-sex pyramid is a population pyramid. Graphically, it represents the trend of the population size concerning the gender. It also represents the various age groups of the population.
Complete answer:
The shape of the pyramids directs towards the pattern of the growth of the population. Typically it is used to analyze the growth pattern of a population in a country. In the pyramid, males are represented on the left side while females are represented on the right in the standard format. So the age of a particular population in a particular area can be assessed along with gender classification through the age-sex pyramid.
In the given pyramids, we observe that there is only a slight difference between the two pyramids. In pyramid B, there are a greater number of young individuals as compared to A. This implies that the pyramid B is of an earlier assay since the population has taken measures to decrease the population strength.
The pyramid A has a slightly narrower base than pyramid B. This indicates that the population represented by the pyramid A is more recent and that the measures taken by the country were successful.
Hence, the correct answer is option (B).
Note: The age-sex pyramids lay a helping hand in doing surveys in the field of ecology and thus take necessary steps to keep the growing population under control. The rate of the growth of the population can also be estimated through the pyramids. The pyramid also indicates the reproductive capacity of the population under survey.
Recently Updated Pages
Master Class 11 Social Science: Engaging Questions & Answers for Success
Master Class 11 English: Engaging Questions & Answers for Success
Master Class 11 Maths: Engaging Questions & Answers for Success
Master Class 11 Chemistry: Engaging Questions & Answers for Success
Master Class 11 Biology: Engaging Questions & Answers for Success
Master Class 11 Physics: Engaging Questions & Answers for Success
Trending doubts
Differentiate between an exothermic and an endothermic class 11 chemistry CBSE
One Metric ton is equal to kg A 10000 B 1000 C 100 class 11 physics CBSE
Difference Between Prokaryotic Cells and Eukaryotic Cells
There are 720 permutations of the digits 1 2 3 4 5 class 11 maths CBSE
Draw a diagram of a plant cell and label at least eight class 11 biology CBSE
Which chemical is known as king of chemicals A H 2 class 11 chemistry CBSE