




A body moves with a velocity of $2m/s$ for $5s$ , then its velocity uniformly increases to $10m/s$ $5s$ . Thereafter its velocity begins to decrease at a uniform rate until it comes to rest after $10s$ . Plot a v-t graph and d-t graph for the motion of the body. Mark the portions of the graph when the motion is uniform and when the motion is non uniform. From the graph find the total distance moved by the body after $2s$ and $12s$ and in the last $10s$.
Answer
 Verified
636.3k+ views
Hint: From the data we first need to draw the v-t graph and d-t graph. Then we need to use the laws of kinematics for uniform acceleration. We have to apply appropriate formulas for different cases and find out what is required. So let us start with the solutions.
Formula used: $v=u+at,s=ut+\dfrac{1}{2}a{{t}^{2}}$
Complete answer:
For the first 5s the velocity does not change with time, so the v-t graph will be parallel to the time axis and the d-t graph will be a straight line passing through the origin. Then its velocity increases uniformly for next 5s. Thus its v-t graph will be a straight line and d-t graph will be a curved line with tangent at each point giving the value of the velocity at that time. In the last 10s the velocity decreases uniformly and at last becomes zero. So the v-t graph will be a straight line with negative slope and the d-t graph will also be a curved line with negative slope.
The graphs are shown below.
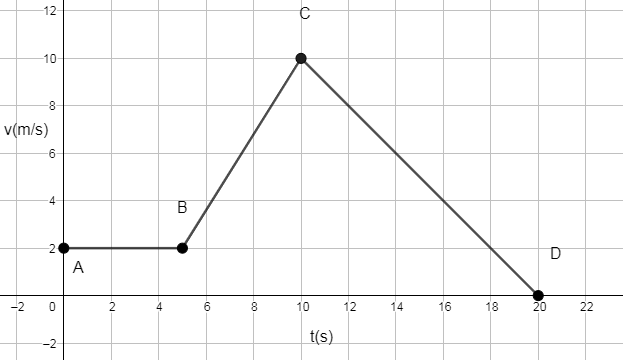
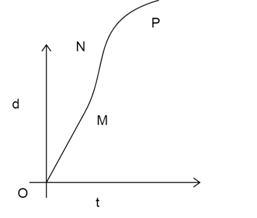
From the v-t graph we can say that motion is uniform in AB part and not uniform in BC and CD parts.
Let the initial velocity be $u.$ Now after $2s$, as we can see from the v-t graph the distance travelled will be
${{S}_{1}}=u\times t=2\times 5=10m$.
Now to evaluate distance for $12s$ we need to find out the acceleration and retardation of the particle when the motion is not uniform.
In the point C the velocity $v=10m{{s}^{-1}}$ , so the acceleration in this part is given by
$a=\dfrac{v-u}{\vartriangle t}=\dfrac{10-2}{10-5}m{{s}^{-2}}=1.6m{{s}^{-2}}$ . Thus the distance travelled in this time interval is
\[{{S}_{2}}=ut+\dfrac{1}{2}a{{t}^{2}}=2\times 2+(\dfrac{1}{2}\times 1.6\times {{5}^{2}})m=24m\]
Now in the portion CD it travels with the retardation given by
$r=\dfrac{10-0}{20-10}m{{s}^{-2}}=1m{{s}^{-2}}$
The particle travels with this retardation for last $2s$ of $12s$. So the distance travelled in this $2s$is given by
${{S}_{3}}=10\times 2-(\dfrac{1}{2}\times 1\times {{2}^{2}})m=18m$
So the distance travelled in 12s is
${{S}_{1}}+{{S}_{2}}+{{S}_{3}}=10+24+18=52m$ .
In the last $10s$, the particle moves with retardation. So putting the values of different quantities from the graph and from earlier calculations we get
${{S}_{4}}=10\times 10-(\dfrac{1}{2}\times 1\times {{10}^{2}})m=50m$
Note:
The velocities and accelerations are different in different points of the graph, they should be calculated correctly. To calculate distance travelled in 12s, the approach of finding displacement by the area of the graph with the time axis will not work, we have to apply the kinematics equation for that. Again these equations are only valid for uniform accelerations.
Formula used: $v=u+at,s=ut+\dfrac{1}{2}a{{t}^{2}}$
Complete answer:
For the first 5s the velocity does not change with time, so the v-t graph will be parallel to the time axis and the d-t graph will be a straight line passing through the origin. Then its velocity increases uniformly for next 5s. Thus its v-t graph will be a straight line and d-t graph will be a curved line with tangent at each point giving the value of the velocity at that time. In the last 10s the velocity decreases uniformly and at last becomes zero. So the v-t graph will be a straight line with negative slope and the d-t graph will also be a curved line with negative slope.
The graphs are shown below.
From the v-t graph we can say that motion is uniform in AB part and not uniform in BC and CD parts.
Let the initial velocity be $u.$ Now after $2s$, as we can see from the v-t graph the distance travelled will be
${{S}_{1}}=u\times t=2\times 5=10m$.
Now to evaluate distance for $12s$ we need to find out the acceleration and retardation of the particle when the motion is not uniform.
In the point C the velocity $v=10m{{s}^{-1}}$ , so the acceleration in this part is given by
$a=\dfrac{v-u}{\vartriangle t}=\dfrac{10-2}{10-5}m{{s}^{-2}}=1.6m{{s}^{-2}}$ . Thus the distance travelled in this time interval is
\[{{S}_{2}}=ut+\dfrac{1}{2}a{{t}^{2}}=2\times 2+(\dfrac{1}{2}\times 1.6\times {{5}^{2}})m=24m\]
Now in the portion CD it travels with the retardation given by
$r=\dfrac{10-0}{20-10}m{{s}^{-2}}=1m{{s}^{-2}}$
The particle travels with this retardation for last $2s$ of $12s$. So the distance travelled in this $2s$is given by
${{S}_{3}}=10\times 2-(\dfrac{1}{2}\times 1\times {{2}^{2}})m=18m$
So the distance travelled in 12s is
${{S}_{1}}+{{S}_{2}}+{{S}_{3}}=10+24+18=52m$ .
In the last $10s$, the particle moves with retardation. So putting the values of different quantities from the graph and from earlier calculations we get
${{S}_{4}}=10\times 10-(\dfrac{1}{2}\times 1\times {{10}^{2}})m=50m$
Note:
The velocities and accelerations are different in different points of the graph, they should be calculated correctly. To calculate distance travelled in 12s, the approach of finding displacement by the area of the graph with the time axis will not work, we have to apply the kinematics equation for that. Again these equations are only valid for uniform accelerations.
Recently Updated Pages
If x a + bt + ct2 where x is in meters and t is in class 11 physics CBSE

A car covers the first half distance between two places class 11 physics CBSE
The resultant of two vectors overrightarrow P and overrightarrow class 11 physics CBSE
Find the value of cos 135 class 11 maths CBSE
A mass M is held in place by an applied force F and class 11 physics CBSE
A solution of glucose in water is labelled as 10 dfracwv class 11 chemistry CBSE
Trending doubts
One Metric ton is equal to kg A 10000 B 1000 C 100 class 11 physics CBSE
Find the value of the expression given below sin 30circ class 11 maths CBSE
What do you mean by retardation What is its SI uni class 11 physics CBSE
Draw a diagram of nephron and explain its structur class 11 biology CBSE
10 examples of friction in our daily life
Difference between physical and chemical change class 11 chemistry CBSE