


Step-by-Step Solutions For Class 8 Maths Chapter 5 In Hindi - Free PDF Download
प्रश्नावली 5.1
1. निम्नलिखित में से किन आंकड़ों को दशनि के लिए आप एक आयतचित्र का प्रयोग करेंगे ? प्रत्येक के लिए, कारण भी दीजिए।
a. एक डाकिए के थैले में विभिन्न क्षेत्र के पत्रों की संख्या |
उत्तर : नहीं , इसे आयात चित्र में नही दर्शा सकते परन्तु एक दंड आरेख में प्रदर्शित कर सकते हैं जिससे प्रत्येक क्षेत्र के पत्रों की संख्या को सरलतापूर्वक जाना जा सकता है।
b. किसी खेलकूद प्रतियोगिता में प्रत्याशियों की ऊंचाइयां ।
उत्तर: हाँ, इसे वर्ग अंतराल का प्रयोग करके एक आयतचित्र में प्रदर्शित कर सकते है जिससे सरलतापूर्वक प्रत्येक ऊंचाई वर्ग के प्रतियोगियों की संख्या को आसानी से जान सकते है|
c. 5 कंपनियों द्वारा निर्मित कैसेटों की संख्या ।
उत्तर : नहीं , इसे आयात चित्र में नही दर्शा सकते परन्तु एक दंड आरेख में प्रदर्शित कर सकते हैं जिससे प्रत्येक कंपनी के कैसेटों की संख्या को आसानी से जान सकते है।
d. किसी स्टेशन पर प्रातः 7:00 से सायं 7:00 बजे तक रेलगाड़ियों से जाने वाली यात्रियों की संख्या
उत्तर: हाँ, इसे वर्ग अंतराल का प्रयोग करके एक आयतचित्र में प्रदर्शित कर सकते है जिससे किसी समय अंतराल में यात्रियों की संख्या जान सकते है।
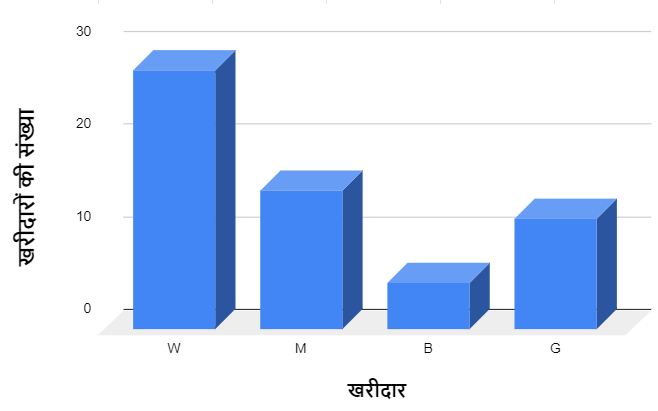
2. किसी विभागीय स्तर पर खरीदारी करने आए व्यक्तियों को इस प्रकार अंकित किया जाता है पुरुष (M), महिला (W) लड़का (B) या लड़की (G) । निम्नलिखित सूची उन खरीददारों को दर्शाती है जो प्रातः काल पहले घंटे में आए हैं:
W W W G B W W M G G M M W W W W G B M W B G G M M W G W M G W M M B G G W
मिलान चिन्ह का प्रयोग करते हुए एक बारंबारता बटन सारणी बनाइए। इसे प्रदर्शित करने के लिए एक दंड आलेख खींचिए ।
उत्तर: बारंबारता बंटन सारणी
|||||
दंड आलेख
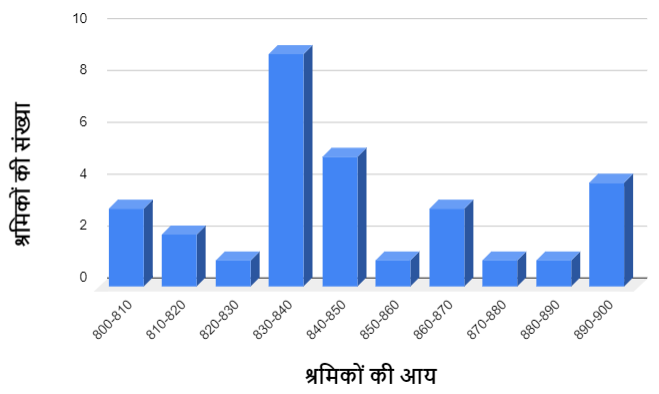
3. किसी फैक्ट्री के 30 श्रमिकों की साप्ताहिक मजदूरी (रुपयों में) निम्नलिखित है :
830, 835, 890, 810, 835, 836, 869, 845, 898, 890, 820, 860, 832, 833, 855, 845, 804, 808, 812, 840, 885, 835, 835, 836, 878, 840, 868, 890, 806, 840 मिलान चिन्ह का प्रयोग करते हुए अंतरालो 800-810, 810-820 इत्यादि वाली एक बारंबारता सारणी बनाइए।
उत्तर:
4. प्रश्न 3 में दिए आंकड़ों से प्राप्त सारणी के लिए एक आयत चित्र बनाइए और निम्नलिखित प्रश्नों के उत्तर दीजिए:
a. किस समूह में श्रमिकों की संख्या सबसे अधिक है ?
उत्तर: 830-840 वाले समूह में श्रमिकों की संख्या सबसे अधिक है |
b. कितने श्रमिक 850 रुपए या उससे अधिक अर्जित करते हैं ?
उत्तर: 10 श्रमिक ऐसे है जो 850 रुपए या उससे अधिक अर्जित करते हैं।
c. कितने श्रमिक 850 रुपए से कम अर्जित करते हैं?
उत्तर: 20 श्रमिक ऐसे है जो 850 रुपए से कम अर्जित करते हैं।
उत्तर:
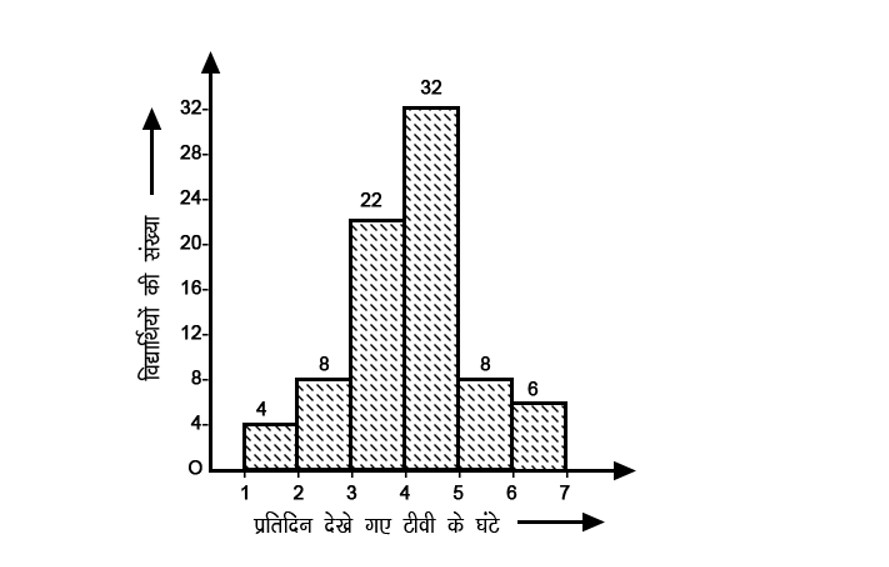
5. अवकाश के दिनों में एक विशिष्ट कक्षा के विद्यार्थियों द्वारा प्रतिदिन टेलीविज़न (टीवी) देखने का समय (घंटों में) दिए हुए आलेख में दर्शाए गए हैं:
निम्नलिखित प्रश्नों के उत्तर दीजिए:
a. अधिकतम विद्यार्थियों ने कितने घंटे तक टीवी देखा ?
उत्तर: अधिकतम विद्यार्थियों जिनकी संख्या 32 है उन्होंने 4 से 5 घंटे तक टीवी देखा ।
b. 4 घंटे से कम समय तक कितने विद्यार्थियों ने टीवी देखा ?
उत्तर: 34 विद्यार्थियों ने 4 घंटे से कम समय तक टीवी देखा ।
c. कितना विद्यार्थियों ने टीवी देखने में 5 घंटे से अधिक का समय व्यतीत किया ?
उत्तर: कुल 14 विद्यार्थियों ने टीवी देखने में 5 घंटे से अधिक का समय व्यतीत किया।
प्रश्नावली 5.2
1. किसी शहर के युवा व्यक्तियों के एक समूह का यह जानने के लिए एक सर्वे किया गया कि वह किस प्रकार का संगीत पसंद करते हैं। इनसे प्राप्त आंकड़ों को संग्लन पाई चार्ट में दर्शाया गया है।
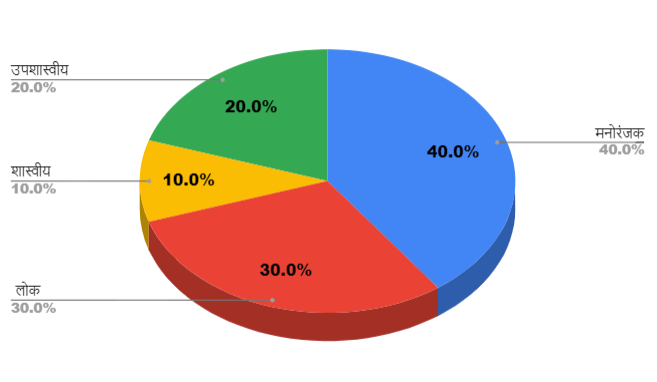
इस पाई चार्ट से निम्नलिखित प्रश्नों के उत्तर दीजिए:
a. यदि 20 व्यक्ति शास्त्रीय संगीत पसंद करते हैं, तो कुल कितने युवा व्यक्तियों का सर्वे किया गया था ?
उत्तर: माना ऐसे व्यक्तियों की कुल संख्या $=x$
दिया गया है शास्त्रीय संगीत प्रतिशत= $10 \%$
अब शास्त्रीय संगीत पसंद करने वाले व्यक्तियों की संख्या $=x$ का $10 \%=20$
या $\mathrm{X}\left(\frac{10}{100}\right)=20$
या $\mathrm{X}=200$
अतः सर्वे के कुल युवा व्यक्तियों की संख्या $=200$
b. किस प्रकार का संगीत सबसे अधिक व्यक्तियों द्वारा पसंद किया जाता है ?
उत्तर: मनोरंजक संगीत का प्रतिशत मान अधिक है इसलिए इसे सबसे अधिक व्यक्तियों द्वारा पसंद किया जाता है।
c. यदि कोई कैसेट कंपनी 1000 सीडी बनाए, तो वह प्रत्येक प्रकार की कितनी सीडी बनाएगी ?
उत्तर: शास्त्रीय संगीत की $\mathrm{CD}$ की संख्या $=\frac{10 \times 1000}{100}=100$
उसी प्रकार उप शास्त्रीय संगीत की $\mathrm{CD}$ की संख्या $=\frac{20 \times 1000}{100}=200$
उसी प्रकार मनोरंजक संगीत की $C D$ की संख्या $=\frac{40 \times 1000}{100}=400$
तथा लोक संगीत की $\mathrm{CD}$ की संख्या $=\frac{30 \times 1000}{100}=300$
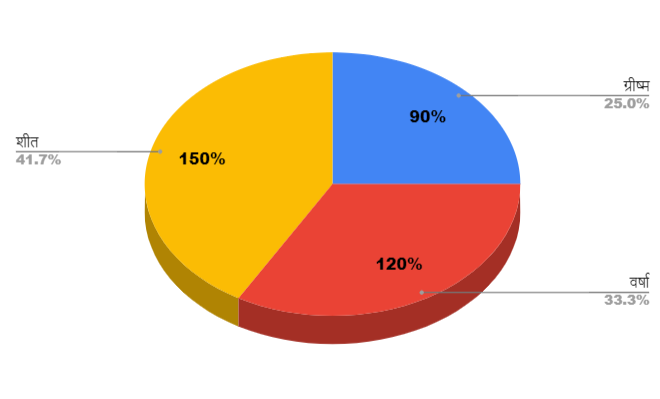
2. 360 व्यक्तियों के एक समूह से तीन ऋतुओं वर्षा, सर्दी और गर्मी में से अपनी मनपसंद ऋतु के लिए मतदान करने को कहा गया। इनसे प्राप्त आंकड़ों का संलग्न चित्र में दर्शाया गया है:
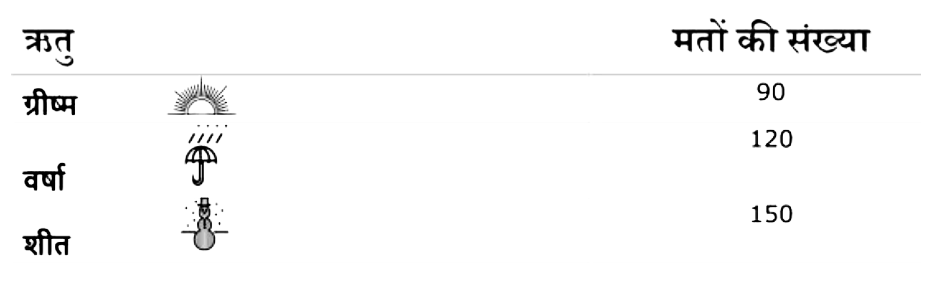
a. किस ऋतु को सबसे अधिक मत मिले|
उत्तर: शीत ऋतु को सबसे अधिक मत मिले।
b. प्रत्येक त्रिज्यखंड का केंद्रीय कोण ज्ञात कीजिए।
उत्तर: चुकि कुल केंद्रीय कोण= 360°
ग्रीष्म ऋतु का केंद्रीय कोण $=\frac{90^{\circ} \times 360^{\circ}}{360^{\circ}}=90^{\circ}$
उसी प्रकार वर्षा ऋतु का केंद्रीय कोण $=\frac{120^{\circ} \times 360^{\circ}}{360^{\circ}}=120^{\circ}$
तथा शीत ऋतु का केंद्रीय कोण $=\frac{150^{\circ} \times 360^{\circ}}{360^{\circ}}=150^{\circ}$
c. इस सूचना को दर्शाने के लिए, एक पाई चार्ट खींचिए ।
उत्तर:
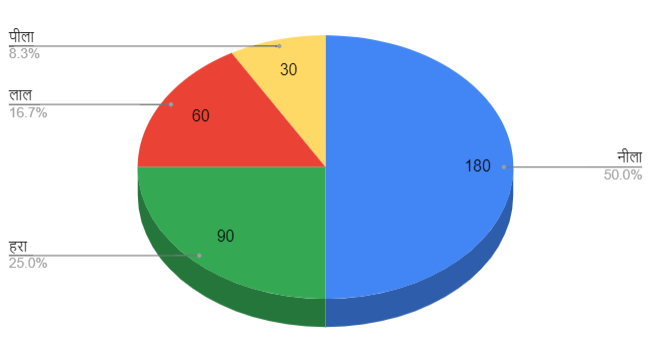
3. निम्नलिखित सूचना को दर्शाने वाला एक पाई चार्ट खींचिए । यह सारणी व्यक्तियों के एक समूह द्वारा पसंद किए जाने वाले रंगों को दर्शाती है।
उत्तर: सर्वप्रथम प्रत्येक का त्रिज्यखंड का मान प्राप्त करते है
यहां केंद्रीय कोण $=360^{\circ}$
व्यक्तियों की कुल संख्या $=36$
नीले रंग का केंद्रीय कोण $=\frac{18 \times 360^{\circ}}{36}=180^{\circ}$
हरे रंग का केंद्रीय कोण $=\frac{9 \times 360^{\circ}}{36}=90^{\circ}$
लाल रंग का केंद्रीय कोण $=\frac{6 \times 360^{\circ}}{36}=60^{\circ}$
पीले रंग का केंद्रीय कोण $=\frac{3 \times 360^{\circ}}{36}=30^{\circ}$
अत: पाई चार्ट
4. संगम पाई चार्ट एक विद्यार्थी द्वारा किसी परीक्षा में हिंदी, अंग्रेजी, गणित, सामाजिक विज्ञान और विज्ञान में प्राप्त किए गए अंकों को दर्शाता है। यदि उस विद्यार्थी द्वारा प्राप्त किए गए कुल अंक 540 थे, तो निम्नलिखित प्रश्नों के उत्तर दीजिए:
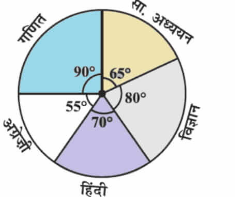
उत्तर: सर्वप्रथम प्रत्येक का त्रिज्यखंड का मान प्राप्त करते है गणित विषय का केंद्रीय कोण $=\frac{90^{\circ} \times 540}{360^{\circ}}=135$
सामाजिक विज्ञान विषय का केंद्रीय कोण $=\frac{65^{\circ} \times 540}{360^{\circ}}=97.5$ विज्ञानं विषय का केंद्रीय कोण $=\frac{80^{\circ} \times 540}{360^{\circ}}=120$
हिंदी विषय का केंद्रीय कोण $=\frac{70^{\circ} \times 540}{360^{\circ}}=105$
अंग्रेजी विषय का केंद्रीय कोण $=\frac{55^{\circ} \times 540}{360^{\circ}}=82.5$
a. किस विषय में उस विद्यार्थी ने 105 अंक प्राप्त किए ?
(संकेत: 540 अंकों के लिए केंद्र कोण 360° है अतः 105 अंकों के लिए केंद्रीय कोण क्या होगा ?)
उत्तर: विद्यार्थी ने हिन्दी विषय में 105 अंक प्राप्त किए।
b. उस विद्यार्थी ने गणित में हिंदी से कितने अधिक अंक प्राप्त किए ?
उत्तर: विद्यार्थी द्वारा गणित में प्राप्त अंक= 135
हिंदी में प्राप्त अंक = 105
दोनों विषयों का अंतर = 135 - 105 = 30
अतः, विद्यार्थी ने गणित में हिंदी से 30 अंक ज्यादा प्राप्त किए।
c. जांच कीजिए कि क्या सामाजिक विज्ञान और गणित में प्राप्त किए गए अंकों का योग विज्ञान और हिंदी में प्राप्त किए अंकों के योग से अधिक है। (संकेत: केवल केंद्रीय कोणों पर ध्यान दीजिए ।)
उत्तर: सामाजिक विज्ञान और गणित में प्राप्त अंको का योग =97.5 +135=232.5
उसी प्रकार विज्ञान और हिंदी में प्राप्त अंकों का योग = 120 + 105 = 225
इससे स्पस्ट है कि सामाजिक विज्ञान और गणित में मिले कुल अंकों का योग, उसके विज्ञान और हिंदी में मिले अंकों के अधिक है |यह 7.5 अधिक है|
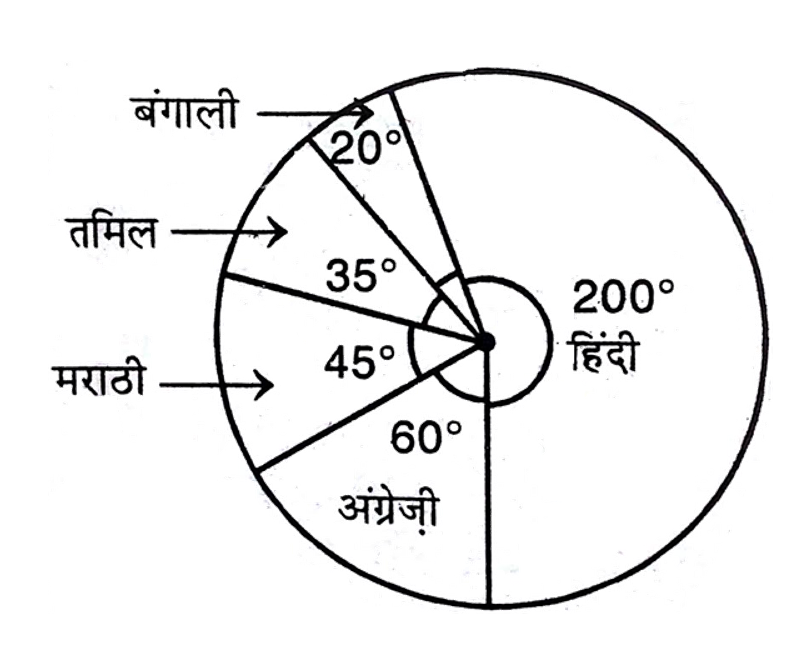
5. किसी छात्रावास में विभिन्न भाषाएं बोलने वाले विद्यार्थियों की संख्या नीचे दी गई है। इन आंकड़ों को एक पाई चार्ट द्वारा प्रदर्शित कीजिए।
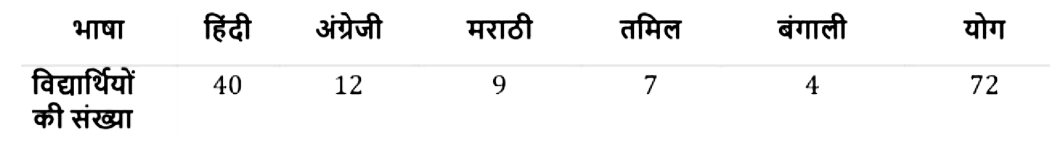
उत्तर: सर्वप्रथम प्रत्येक का त्रिज्यखंड का मान प्राप्त करते है
हिंदी का केंद्रीय कोण $=\frac{40 \times 360^{\circ}}{72}=200^{\circ}$
अंग्रेजी का केंद्रीय कोण $=\frac{12 \times 360^{\circ}}{72}=60^{\circ}$
मराठी का केंद्रीय कोण $=\frac{9 \times 360^{\circ}}{72}=45^{\circ}$
तमिल का केंद्रीय कोण $=\frac{7 \times 360^{\circ}}{72}=35^{\circ}$
बंगाली का केंद्रीय कोण $=\frac{4 \times 360^{\circ}}{72}=20^{\circ}$
अत: पाई चार्ट
NCERT Solutions for Class 8 Maths Chapter 5 Data Handling in Hindi
Chapter-wise NCERT Solutions are provided everywhere on the internet with an aim to help the students to gain a comprehensive understanding. Class 8 Maths Chapter 5 solution Hindi medium is created by our in-house experts keeping the understanding ability of all types of candidates in mind. NCERT textbooks and solutions are built to give a strong foundation to every concept. These NCERT Solutions for Class 8 Maths Chapter 5 in Hindi ensure a smooth understanding of all the concepts including the advanced concepts covered in the textbook.
NCERT Solutions for Class 8 Maths Chapter 5 in Hindi medium PDF download are easily available on our official website (vedantu.com). Upon visiting the website, you have to register on the website with your phone number and email address. Then you will be able to download all the study materials of your preference in a click. You can also download the Class 8 Maths Data Handling solution Hindi medium from Vedantu app as well by following the similar procedures, but you have to download the app from Google play store before doing that.
NCERT Solutions in Hindi medium have been created keeping those students in mind who are studying in a Hindi medium school. These NCERT Solutions for Class 8 Maths Data Handling in Hindi medium pdf download have innumerable benefits as these are created in simple and easy-to-understand language. The best feature of these solutions is a free download option. Students of Class 8 can download these solutions at any time as per their convenience for self-study purpose.
These solutions are nothing but a compilation of all the answers to the questions of the textbook exercises. The answers/solutions are given in a stepwise format and very well researched by the subject matter experts who have relevant experience in this field. Relevant diagrams, graphs, illustrations are provided along with the answers wherever required. In nutshell, NCERT Solutions for Class 8 Maths in Hindi come really handy in exam preparation and quick revision as well prior to the final examinations.

FAQs on NCERT Solutions For Class 8 Maths In Hindi Chapter 5 Data Handling - 2025-26
1. Where can I get the accurate solution for NCERT Solution for Class 8 Maths Chapter 5?
The NCERT solutions are designed by subject matter experts with extensive dedication and consideration. The language used is easily comprehensible, helping the student to grasp the concepts without any doubts. Moreover, the exercises present have detailed and explanatory solutions helping the student in every step making the understanding process every easier. A student can avail of these solutions on the website of Vedantu (vedantu) where he can access free PDFs of every chapter and practice to score well in examinations. Students can also download the mobile app of Vedantu and study the solutions anywhere, anytime, free of cost.
2. Is it necessary to solve each problem provided in the NCERT Solution for Class 8 Maths Chapter 5?
It becomes important to solve every problem provided in the NCERT Solution for Class 8 NCERT Solutions for Class 8 Maths Chapter 5 and understand the basic concepts and patterns in order to be able to solve those in the examination as well. The NCERT solution can be availed on the website of Vedantu as it helps and assists the students in understanding these concepts in a detailed and explanatory manner with the help of simple and compact language helping them get familiarized with the concepts of Data Handling.
The various exercises help the students in understanding the pattern of different questions that may be asked in the examination. With practice, students can polish and strengthen their concepts, which helps in scoring good grades.
3. What are the important topics of chapter Data Handling?
The important topics in this chapter include the understanding of;
Frequency, which presents the number of times a particular entry might have occurred.
Grouped frequency distribution, where the data is grouped and presented systematically.
This grouped data is presented using the histogram, which is a bar diagram, where the Class intervals are shown using the horizontal axis, and the frequency of the Class interval is shown by the heights of the bar.
This data can also be presented using the circle graph or the pie chart.
When an outcome cannot be predicted in advance, it is termed a random experiment.
These are a few important topics that come under this chapter. The NCERT Solutions provide the students with all the basic concepts and topics that they need to know to get a clear understanding.
4. Is CBSE Class 8 Maths tough?
With practice, nothing remains tough anymore. The NCERT Solutions for Class 8 Maths help the students in practicing and strengthening their concepts, which clears all their doubts and makes all the basic concepts crystal clear. These exercises are designed by subject matter experts, keeping in mind the needs of the students. The language used is clear and compact, helping the students to understand the concepts easily. Moreover, the various exercises presented to the students have detailed, thorough and all-inclusive answers making every step of the student smooth and easy, which helps the student to familiarize themselves with the concepts of Data Handling.
5. What is Data Handling?
The raw information collected by an observer is called the data or the raw data. This information is collected in context with the situation that the observer might want to study. This data collected is the unorganized form of data that needs to be organized. The process of organization gives us the frequency of that particular data, which is the number of times that a particular entry may have occurred. Therefore, the data usually available to us is unorganized data or the raw data, which needs to be organized systematically to draw meaningful inferences from it. This is done with the understanding of Data Handling.